TL;DR: Create a WPF FastLine Chart with plot bands to analyze global population trends by age group, covering both historical data and future projections. This guide includes data preparation, chart configuration, and customization techniques for effective data visualization.
Welcome to the Chart of the Week blog series!
Today, we’ll explore how to analyze global population trends by age group, covering both historical data and future projections. To visualize the data, we’ll create a WPF FastLine Chart with plot bands using the Syncfusion WPF Charts control. We’ll also discuss various customization techniques, such as axis customization, series palette adjustments, and adding plot bands for enhanced data visualization.
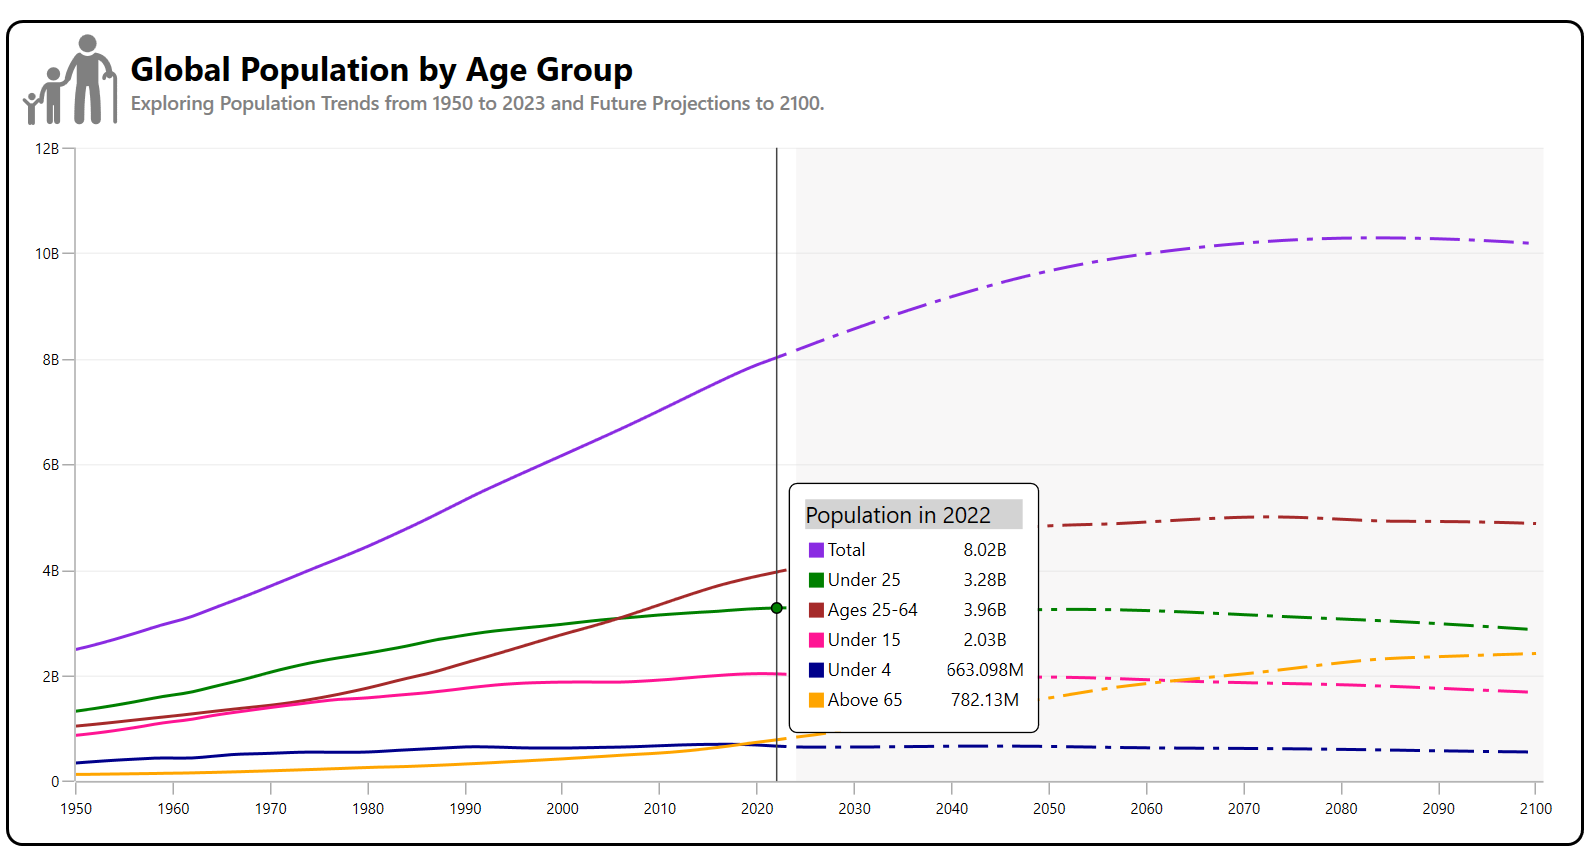
Plot bands are useful features that allow us to highlight specific regions within the chart, aiding in analyzing population trends across different age groups. In this example, we’ll look at the global population from 1950 to 2100. The population will be categorized into various age groups, and we’ll use plot bands to shade key periods (future trends), making the data easier to interpret.
Refer to the following image.
Let’s get started!
Step 1: Collecting the data
First, we’ll gather data on the global population categorized by age groups, including historical and projected figures. This data is sourced from the Our World in Data, covering the period from 1950 to 2100. The extracted data is available as a CSV file on GitHub.
Step 2: Preparing the data for the chart
Create a Model to represent the global population based on age groups. Refer to the following code example.
public class Model
{
    public double Year { get; set; }
    public double TotalPopulation { get; set; }
    public double Under25 { get; set; }
    public double Between25to64 { get; set; }
    public double Under15 { get; set; }
    public double Under4 { get; set; }
    public double Above65 { get; set; }

    public Model(double year, double totalPopulation, double under25, double between25to64, double under15, double under4, double above65)
    {
        Year = year;
        TotalPopulation = totalPopulation;
        Under25 = under25;
        Between25to64 = between25to64;
        Under15 = under15;
        Under4 = under4;
        Above65 = above65;
    }
}
Then, create a ViewModel to hold two data collections: one for historical population analysis and another for forecasted population analysis. The data is generated from a CSV file.
Refer to the following code example.
public class ViewModel
{
    public ObservableCollection<Model> HistoricalPopulationData { get; set; }
    public ObservableCollection<Model> ForecastPopulationData { get; set; }

    public ViewModel()
    {
        HistoricalPopulationData = new ObservableCollection<Model>();
        ForecastPopulationData = new ObservableCollection<Model>();
        ReadCSV("ForecastFastLineChartWithPlotBand.data.csv");
    }

    private void ReadCSV(string fileName)
    {
        Assembly executingAssembly = typeof(App).GetTypeInfo().Assembly;
        Stream inputStream = executingAssembly.GetManifestResourceStream(fileName);
        if (inputStream != null)
        {
            string line;
            List<String> lines = new List<String>();
            StreamReader reader = new StreamReader(inputStream);
            while ((line = reader.ReadLine()) != null)
            {
                lines.Add(line);
            }

            lines.RemoveAt(0);

            for (int i = 0; i < lines.Count; i++)
            {
                string input = lines[i];
                string[] data = input.Split(',');
                var year = Convert.ToDouble(data);

                if (year <= 2023)
                {
                    var model = new Model(
                        year,
                        Convert.ToDouble(data[3]),
                        Convert.ToDouble(data[10]),
                        Convert.ToDouble(data[7]),
                        Convert.ToDouble(data[11]),
                        Convert.ToDouble(data[13]),
                        Convert.ToDouble(data[5])
                    );
                    HistoricalPopulationData.Add(model);
                }
                else
                {
                    var model = new Model(
                        year,
                        Convert.ToDouble(data[4]),
                        Convert.ToDouble(data[9]),
                        Convert.ToDouble(data[8]),
                        Convert.ToDouble(data[12]),
                        Convert.ToDouble(data[14]),
                        Convert.ToDouble(data[6])
                    );
                    ForecastPopulationData.Add(model);
                }
            }
        }
    }
}
Step 3: Configure the Syncfusion WPF Charts control
Now, configure the Syncfusion WPF Charts control using this documentation. The PrimaryAxis and SecondaryAxis will be set as Numerical axis axes to represent the years and population count for each age group.
Refer to the following code example.
<Window x:Class="ForecastFastLineChartWithPlotBand.MainWindow"
   …
   xmlns:sync="clr-namespace:Syncfusion.UI.Xaml.Charts;assembly=Syncfusion.SfChart.WPF">


   <sync:SfChart x:Name="chart">

     <sync:SfChart.PrimaryAxis>
       <sync:NumericalAxis/>
     </sync:SfChart.PrimaryAxis>

     <sync:SfChart.SecondaryAxis>
       <sync:NumericalAxis/>
     </sync:SfChart.SecondaryAxis>

</Window>
Step 4: Binding data to the WPF FastLine Chart
To design multiple FastLine charts, we’ll use Syncfusion WPF FastLineSeries instances. Ensure the ViewModel class is properly configured to bind its properties to the chart’s BindingContext.
Refer to the following code example, where the FastLineSeries is updated with the respective ItemsSource, XBindingPath, and YBindingPath properties.
<Window x:Class="ForecastFastLineChartWithPlotBand.MainWindow"
  …
  xmlns:local="clr-namespace:ForecastFastLineChartWithPlotBand"
  xmlns:sync="clr-namespace:Syncfusion.UI.Xaml.Charts;assembly=Syncfusion.SfChart.WPF">


  <sync:SfChart x:Name="chart" HorizontalHeaderAlignment="Left">

   <sync:SfChart.DataContext>
     <local:ViewModel x:Name="viewModel"/>
   </sync:SfChart.DataContext>
   ….
   <sync:FastLineSeries x:Name="series" ItemsSource="{Binding HistoricalPopulationData}" XBindingPath="Year" YBindingPath="TotalPopulation"/>
   <sync:FastLineSeries x:Name="series1" ItemsSource="{Binding HistoricalPopulationData}" XBindingPath="Year" YBindingPath="Under25"/>
   <sync:FastLineSeries x:Name="series2" ItemsSource="{Binding HistoricalPopulationData}" XBindingPath="Year" YBindingPath="Between25to64"/>
   <sync:FastLineSeries x:Name="series3" ItemsSource="{Binding HistoricalPopulationData}" XBindingPath="Year" YBindingPath="Under15"/>
   <sync:FastLineSeries x:Name="series4" ItemsSource="{Binding HistoricalPopulationData}" XBindingPath="Year" YBindingPath="Under4"/>
   <sync:FastLineSeries x:Name="series5" ItemsSource="{Binding HistoricalPopulationData}" XBindingPath="Year" YBindingPath="Above65"/>

   <sync:FastLineSeries x:Name="series6" ItemsSource="{Binding ForecastPopulationData }" StrokeDashArray="2, 2" XBindingPath="Year" YBindingPath="TotalPopulation"/>
   <sync:FastLineSeries x:Name="series7" ItemsSource="{Binding ForecastPopulationData }" StrokeDashArray="2, 2" XBindingPath="Year" YBindingPath="Under25"/>
   <sync:FastLineSeries x:Name="series8" ItemsSource="{Binding ForecastPopulationData }" StrokeDashArray="2, 2" XBindingPath="Year" YBindingPath="Between25to64"/>
   <sync:FastLineSeries x:Name="series9" ItemsSource="{Binding ForecastPopulationData }" StrokeDashArray="2, 2" XBindingPath="Year" YBindingPath="Under15"/>
   <sync:FastLineSeries x:Name="series10" ItemsSource="{Binding ForecastPopulationData }" StrokeDashArray="2, 2" XBindingPath="Year" YBindingPath="Under4"/>
   <sync:FastLineSeries x:Name="series11" ItemsSource="{Binding ForecastPopulationData }" StrokeDashArray="2, 2" XBindingPath="Year" YBindingPath="Above65"/>

  </sync:SfChart>

</Window>
Step 5: Customize the WPF FastLine Chart appearance
Now, let’s improve the readability of the Syncfusion WPF FastLine Chart by customizing its elements.
Customizing the header
In the Syncfusion WPF Charts control, the Header property is used to define the chart’s title. You can further adjust the alignment of the header using the HorizontalHeaderAlignment property.
<sync:SfChart x:Name="chart" HorizontalHeaderAlignment="Left">

  <sync:SfChart.Header>
    <Border BorderBrush="White" Margin="0, 0, 0, 10">
      <StackPanel Orientation="Horizontal" Margin="-20, 0, 0, 0">
        <Grid>
         <Ellipse Width="5" Height="5" Fill="Gray" Margin="0.5, 15, 0, 0"/>
         <Path Margin="0,35,0,0" Data="{Binding PathData}" Stretch="Uniform" Stroke="Gray" StrokeThickness="1" Fill="Gray" Width="40" Height="18" RenderTransformOrigin="0.5,0.5"/>
        </Grid>
        <Path Margin="-19,-8,0,0" Data="{Binding PathData1}" Stretch="Uniform" Fill="Gray" Width="60" Height="60" RenderTransformOrigin="0.5,0.5"/>
        <StackPanel>
         <TextBlock FontSize="22" Margin="5, 0, 0, 0" Text="Global Population by Age Group" FontWeight="Bold"/>
         <TextBlock FontSize="13" Margin="5, 0, 0, 0" Text="Exploring Population Trends from 1950 to 2023 and Future Projections to 2100." FontWeight="Medium" Foreground="Gray"/>
        </StackPanel>
      </StackPanel>
    </Border> </sync:SfChart.Header>

    …
</sync:SfChart>
Customizing the axis
Let’s customize the chart axis intervals, gridlines, and labels, as shown in the following code example.
<sync:SfChart.PrimaryAxis>
  <sync:NumericalAxis ShowGridLines="False" PlotOffsetEnd="5">
  </sync:NumericalAxis>
</sync:SfChart.PrimaryAxis>

<sync:SfChart.SecondaryAxis>
  <sync:NumericalAxis Interval="2000000000" LabelCreated="NumericalAxis_LabelCreated_1"/>
</sync:SfChart.SecondaryAxis>
Refer to the following code example to format the axis labels in billions.
private void NumericalAxis_LabelCreated_1(object sender, LabelCreatedEventArgs e)
{
    if (e.AxisLabel is ChartAxisLabel label && label.LabelContent is string content && content != "0")
    {
        var value = double.Parse(content) / 1000000000;
        label.LabelContent = value.ToString() + "B";
    }
}
Adding plotbands
Syncfusion WPF Charts control allows us to add striplines (plotbands) to shade specific regions of the plot area for better data visualization. In this example, the stripline starts from 2024 and extends with a width of 100 units. The background color of the stripline has been customized to represent future population trends.
<sync:SfChart.PrimaryAxis>
  <sync:NumericalAxis>
    <sync:NumericalAxis.StripLines>
      <sync:ChartStripLine Start="2024" Width="100" Background="#dbd9d9" Opacity="0.2"/>
    </sync:NumericalAxis.StripLines>
  </sync:NumericalAxis>
</sync:SfChart.PrimaryAxis>
Customizing the series appearance
The WPF FastLine Chart allows us to customize the series’ fill colors. Additionally, the forecasted FastLine series can be customized with a dotted line using the StrokeDashArray property.
public class Model
{
    public Brush Brush1 = new SolidColorBrush(Colors.BlueViolet);
    public Brush Brush2 = new SolidColorBrush(Colors.Green);
    public Brush Brush3 = new SolidColorBrush(Colors.Brown);
    public Brush Brush4 = new SolidColorBrush(Colors.DeepPink);
    public Brush Brush5 = new SolidColorBrush(Colors.DarkBlue);
    public Brush Brush6 = new SolidColorBrush(Colors.Orange);
}
var model = viewModel.HistoricalPopulationData;
series.Interior = series6.Interior = model.Brush1;
series7.Interior = series1.Interior = model.Brush2;
series8.Interior = series2.Interior = model.Brush3;
series9.Interior = series3.Interior = model.Brush4;
series10.Interior = series4.Interior = model.Brush5;
series11.Interior = series5.Interior = model.Brush6;
series6.StrokeDashArray = new System.Windows.Media.DoubleCollection { 10, 3, 2, 3 };
series7.StrokeDashArray = series8.StrokeDashArray = series9.StrokeDashArray = series10.StrokeDashArray = series11.StrokeDashArray = series6.StrokeDashArray;
Customizing the trackball behavior
The ChartTrackBallBehavior allows tracking of data points closest to the cursor position. The visibility of the trackball label can be controlled using the ShowTrackballInfo property. Additionally, you can customize the appearance of the trackball label using the TrackBallLabelTemplate property.
<sync:SfChart x:Name="chart">

 <sync:SfChart.Resources>
   <local:TooltipValueConverter x:Key="converter"/>
   <DataTemplate x:Key="labelTemplate">

     <Border CornerRadius="5" BorderThickness="1" BorderBrush="Black" Background="White" Padding="10" Margin="8">

      <StackPanel Orientation="Vertical">
        <TextBlock Foreground="Black" Background="LightGray" FontSize="15" Text="{Binding Item, Converter={StaticResource converter}, ConverterParameter=0}"/>
           <Grid Margin="0, 5, 0, 0">
             <Grid.RowDefinitions>
               <RowDefinition Height="20"/>
               <RowDefinition Height="20"/>
               <RowDefinition Height="20"/>
               <RowDefinition Height="20"/>
               <RowDefinition Height="20"/>
               <RowDefinition Height="20"/>
             </Grid.RowDefinitions>
             <Grid.ColumnDefinitions>
                <ColumnDefinition Width="15"/>
                <ColumnDefinition Width="80"/>
                <ColumnDefinition Width="50"/>
             </Grid.ColumnDefinitions>

             <StackPanel Background="{Binding Item, .Converter={StaticResource converter}, ConverterParameter=7}" Height="10" Width="10" Margin="0, -2, 0, 0" Grid.Column="0" Grid.Row="0"/>
             <StackPanel Background="{Binding Item, Converter={StaticResource converter}, ConverterParameter=8}" Height="10" Width="10" Margin="0, -2, 0, 0" Grid.Column="0" Grid.Row="1"/>
             <StackPanel Background="{Binding Item, Converter={StaticResource converter}, ConverterParameter=9}" Height="10" Width="10" Margin="0, -2, 0, 0" Grid.Column="0" Grid.Row="2"/>
             <StackPanel Background="{Binding Item, Converter={StaticResource converter}, ConverterParameter=10}" Height="10" Width="10" Margin="0, -2, 0, 0" Grid.Column="0" Grid.Row="3"/>
             <StackPanel Background="{Binding Item, Converter={StaticResource converter}, ConverterParameter=11}" Height="10" Width="10" Margin="0, -2, 0, 0" Grid.Column="0" Grid.Row="4"/>
             <StackPanel Background="{Binding Item, Converter={StaticResource converter}, ConverterParameter=12}" Height="10" Width="10" Margin="0, -2, 0, 0" Grid.Column="0" Grid.Row="5"/>

             <TextBlock Foreground="Black" Text="Total" Grid.Row="0" Grid.Column="1"/>
             <TextBlock Foreground="Black" Text="Under 25"  Grid.Row="1" Grid.Column="1"/>
             <TextBlock Foreground="Black" Text="Ages 25-64"  Grid.Row="2" Grid.Column="1"/>
             <TextBlock Foreground="Black" Text="Under 15"  Grid.Row="3" Grid.Column="1"/>
             <TextBlock Foreground="Black" Text="Under 4"  Grid.Row="4" Grid.Column="1"/>
             <TextBlock Foreground="Black" Text="Above 65"  Grid.Row="5" Grid.Column="1"/>

             <TextBlock Foreground="Black" Text="{Binding Item, Converter={StaticResource converter}, ConverterParameter=1}" Grid.Column="2" Grid.Row="0" HorizontalAlignment="Center"/>
             <TextBlock Foreground="Black" Text="{Binding Item, Converter={StaticResource converter}, ConverterParameter=2}" Grid.Column="2" Grid.Row="1" HorizontalAlignment="Center"/>
             <TextBlock Foreground="Black" Text="{Binding Item, Converter={StaticResource converter}, ConverterParameter=3}" Grid.Column="2" Grid.Row="2" HorizontalAlignment="Center"/>
             <TextBlock Foreground="Black" Text="{Binding Item, Converter={StaticResource converter}, ConverterParameter=4}" Grid.Column="2" Grid.Row="3" HorizontalAlignment="Center"/>
             <TextBlock Foreground="Black" Text="{Binding Item, Converter={StaticResource converter}, ConverterParameter=5}" Grid.Column="2" Grid.Row="4" HorizontalAlignment="Center"/>
             <TextBlock Foreground="Black" Text="{Binding Item, Converter={StaticResource converter}, ConverterParameter=6}" Grid.Column="2" Grid.Row="5" HorizontalAlignment="Center"/>
           </Grid>
         </StackPanel>
       </Border>

   </DataTemplate>

 </sync:SfChart.Resources>

 <sync:SfChart.Behaviors>
     <sync:ChartTrackBallBehavior/>
 </sync:SfChart.Behaviors>

 <sync:FastLineSeries x:Name="series" ShowTrackballInfo="False"/>
 <sync:FastLineSeries x:Name="series1" ShowTrackballInfo="True" TrackBallLabelTemplate="{StaticResource labelTemplate}"/>
 <sync:FastLineSeries x:Name="series2" ShowTrackballInfo="False" />
 <sync:FastLineSeries x:Name="series3" ShowTrackballInfo="False" />
 <sync:FastLineSeries x:Name="series4" ShowTrackballInfo="False" />
 <sync:FastLineSeries x:Name="series5" ShowTrackballInfo="False" />

 <sync:FastLineSeries x:Name="series6" ShowTrackballInfo="False" />
 <sync:FastLineSeries x:Name="series7" ShowTrackballInfo="True" TrackBallLabelTemplate="{StaticResource labelTemplate}"/>
 <sync:FastLineSeries x:Name="series8" ShowTrackballInfo="False" />
 <sync:FastLineSeries x:Name="series9" ShowTrackballInfo="False" />
 <sync:FastLineSeries x:Name="series10" ShowTrackballInfo="False" />
 <sync:FastLineSeries x:Name="series11" ShowTrackballInfo="False" />

</sync:SfChart>
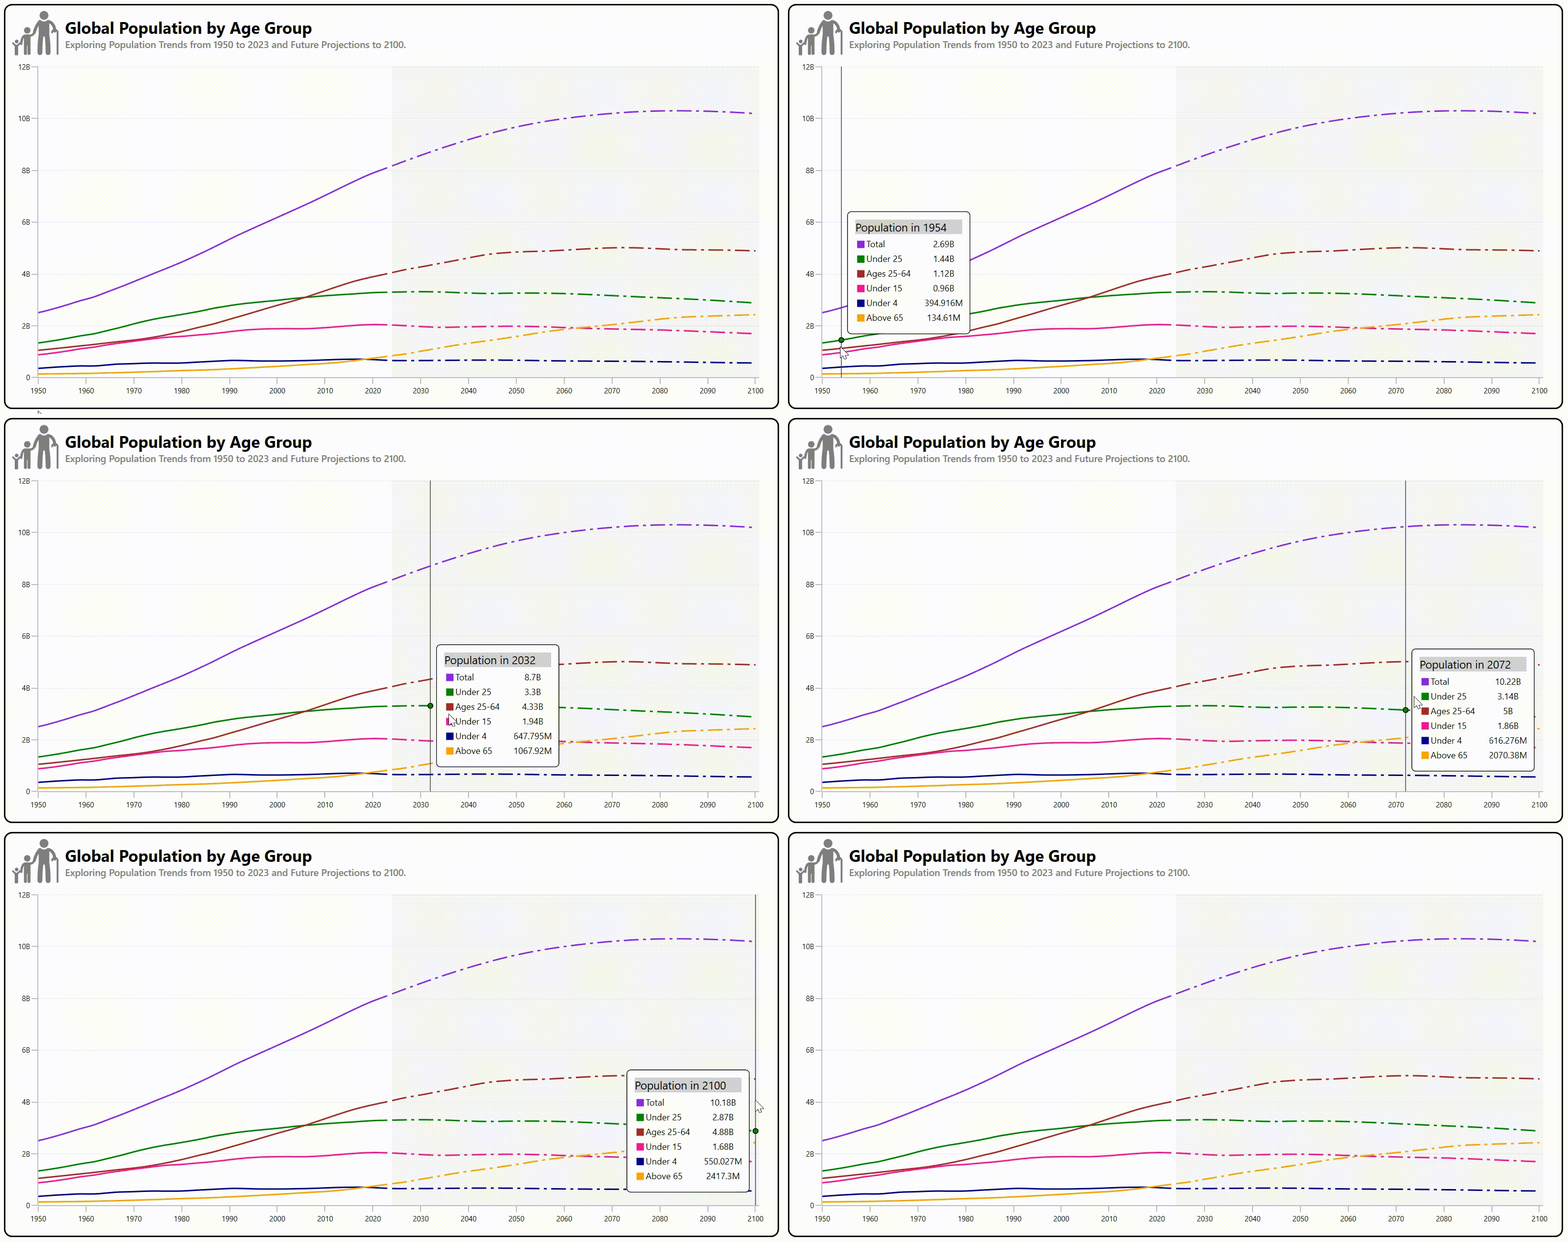
After executing the previous code examples, the output will look like the following image.

GitHub reference
For more details, refer to Visualizing the global population trends by age groups using the WPF FastLine Chart GitHub demo.
Conclusion
Thank you for reading! In this blog, we’ve seen how to analyze and forecast global population trends using the Syncfusion WPF FastLine Chart. We strongly encourage you to follow the steps outlined in this blog and share your feedback in the comments section below.
Existing customers can download the new version of Essential Studio® on the License and Downloads page. If you are not a Syncfusion customer, try our 30-day free trial to check out our incredible features.
If you require any assistance, please don’t hesitate to contact us via our support forums, support portal, or feedback portal. We are always eager to help you!
Related blogs
-
- Clean and Preprocess E-Commerce Website Traffic Data Using an AI-Powered Smart WPF Chart
- Everything You Need to Know About WPF Gantt Control
- Creating a WPF Chart Dashboard to Analyze 2024 T20 World Cup Statistics
- Creating a WPF Doughnut Chart to Visualize the New European Parliament’s Composition in 2024


