Vue.js Devtools made a huge impact on the Vue.js ecosystem. One of the most significant and unique features is the ability to time travel, which is a shift between states that allows you to debug Vue apps quickly.
This article will guide you through how to use Vue.js Devtools efficiently during the development process.
Setting up Vue.js Devtools
Vue.js has provided its Devtools in three different formats: a Chrome extension, a Firefox extension, and a standalone application.
Use as a Chrome extension
 Go to the Chrome web store, search for Vue.js Devtools, and add the extension to the browser.
Use as a Firefox extension
 Search for Vue.js Devtools in the Firefox extension store and add it to the browser.
Use the standalone version
Installing the Vue.js standalone version is straightforward. You can install it globally or as a project dependency by using NPM or Yarn.
-- As locally
npm install -g @vue/devtools
or
yarn global add @vue/devtools

-- As s project dependency
npm install --save-dev @vue/devtools
Then, run the vue-devtools command on the terminal, and the following window will pop up.
 To link the Devtools standalone app, copy and paste the given <script> on the page that needs to be debugged. Then, reload the Vue.js app.
Now, we’ll move on to look at five of its best features in-depth and some practical usage.
Monitoring and editing component data in real time
Navigation to the Components tab provides you a clear view of all the page components on the left, accompanied by the details of the selected component such as props, data, computed, and Vuex bindings on the right.
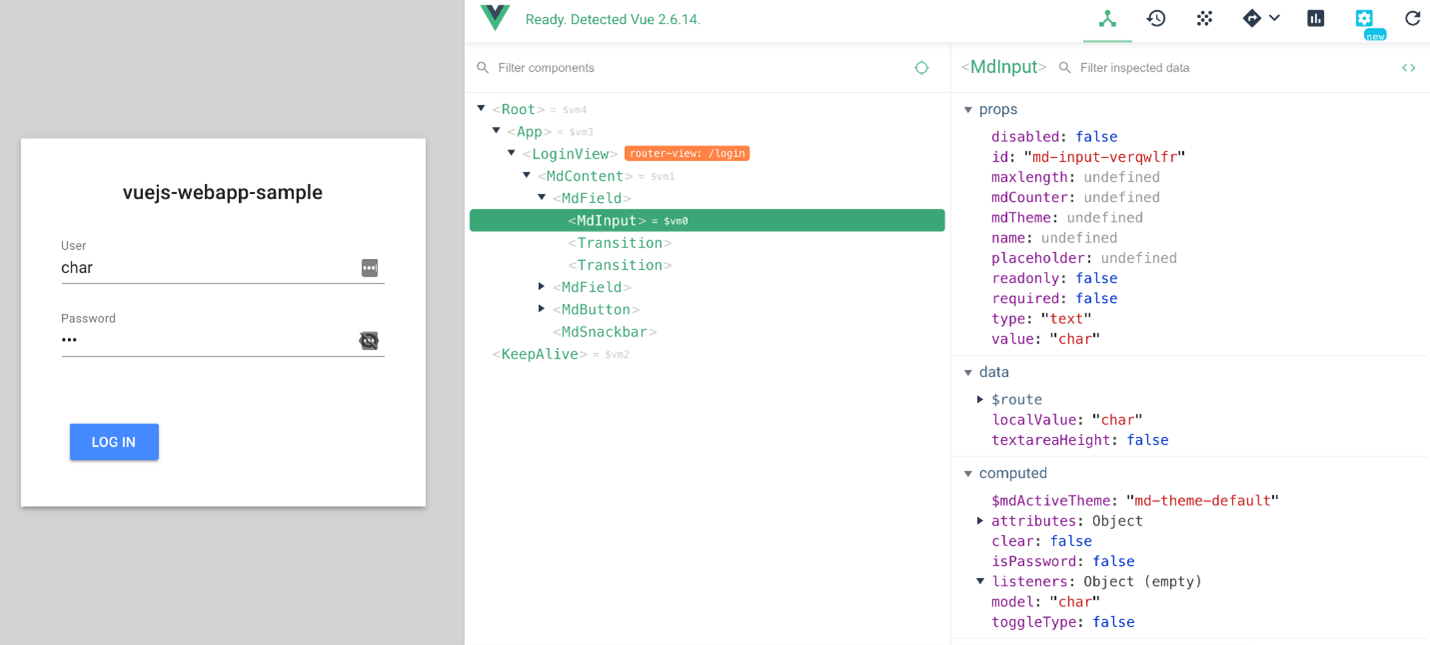 At the same time, you can edit the component data in real time using the Components tab, which makes it fascinating.
Since Vue.js Devtools doesn’t allow editing component data by default. It is necessary to enable it from the Settings tab first. Subsequently, you can select the component and edit its data, including strings, Boolean values, numbers, arrays, and data received from API calls in the browser’s Component tab.
Time traveling through states
Vuex is the state management library in Vue.js. It can easily manage and mutate your application states.
Even though it’s smooth in most of the cases, Vuex also behaves unexpectedly in certain circumstances. In such cases, you can debug the Vuex store easily using Vue.js Devtools, enabling time traveling to prior states.
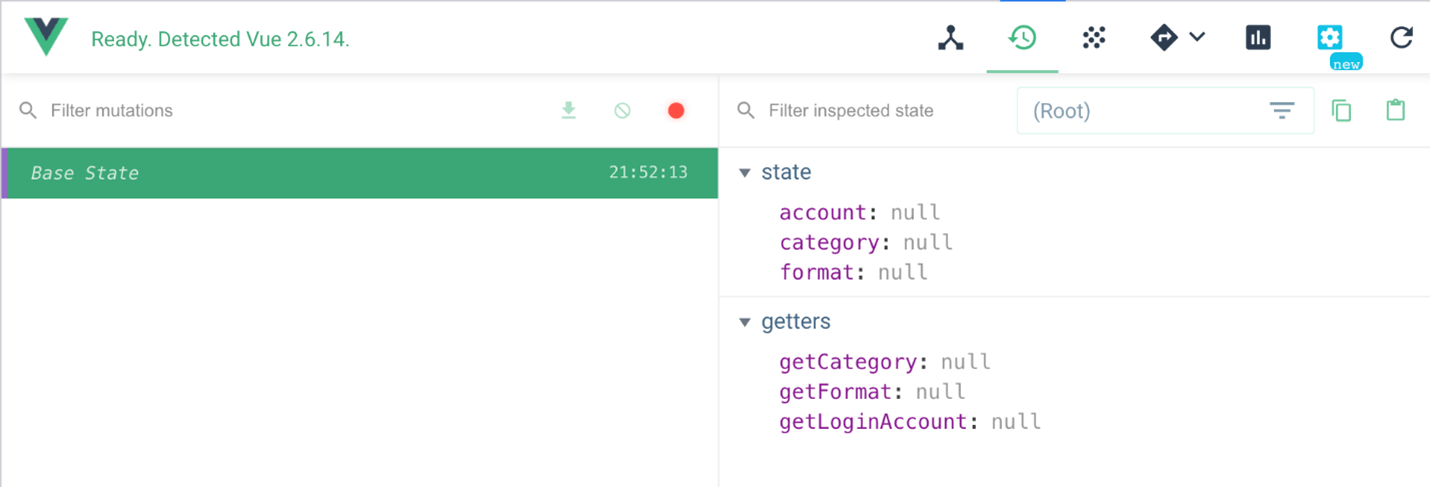 When Vuex dispatches a mutation, it tends to log all the details of app states, allowing you to monitor the state history of your app.
Drifting through these states, you will come across the Time Travel option, which can escort you through time to a particular state.
Providing timing statistics for component lifecycle methods
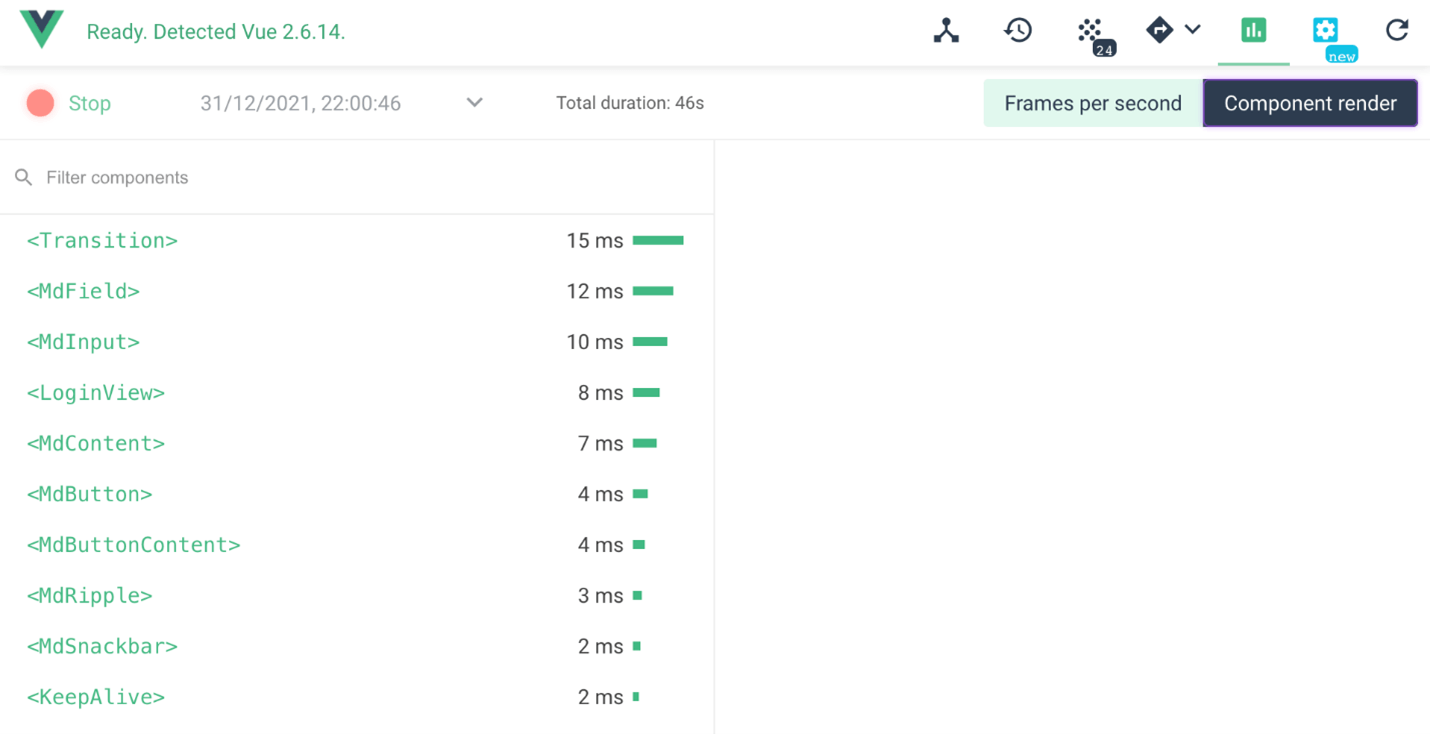
We can measure the Frames per second and Component render parameters using the Performance tab in the Vue.js Devtools.
When you allow the app to run and monitor the frames per second, several frames will be loaded each second. You can see three other labels with letters M, E, and R:
- M: indicates a mutation.
- E: appears when an event is fired.
- R: pops up when there is a change in route.

Thereby, any mutation, event, or route change that affects your app’s performance can easily be detected using the Performance tab.
The Component render section in the Performance tab provides you with a detailed timing description of each component’s lifecycle. It indicates the duration of creating, mounting, updating, or destroying a component.
You can easily find your components of interest, since the component list is ordered based on the time taken to load.
Handle routing
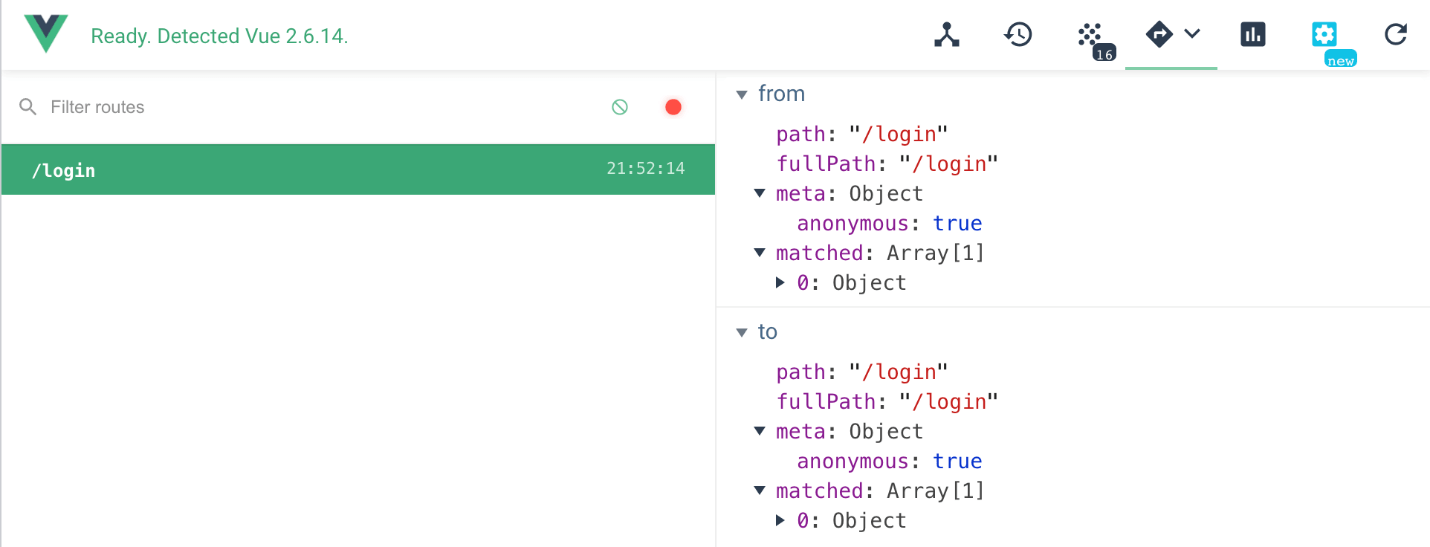
As the lines of code increase when an application grows, tracking all routes and their connections gets difficult. However, Vue.js Devtools compacts and wraps all the routes and their information into a single file. It allows monitoring the app’s routing actions with the user data.
 When you navigate to the Routing tab in the inspect view and select History or Routes, you can track your routes and data in complex applications.
Performance monitoring
Vue.js Devtools collects all the emitted events into a single location. The Events tab monitors and tracks all the custom events of your app, including the source component, name, size, and payload of each event.
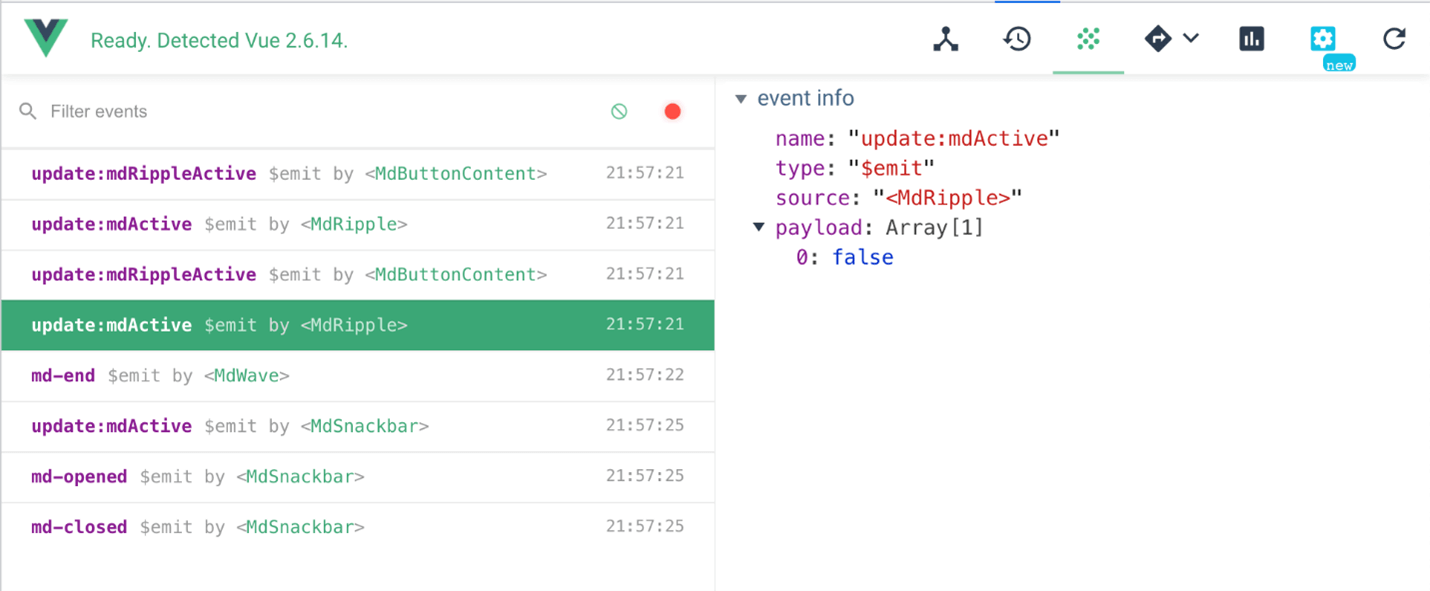 For the record, Vue.js Devtools does not track events like v-on:click or v-on:keyup, and it tracks only the events emitted using this.$emit(‘event_name’).
Conclusion
In a nutshell, we have discussed the methods of installing Vue.js Devtools and some of the features to use to get the best out of it.
We encourage you to be thorough with the facts brought up in this article if you are willing to master Vue.js.
Thank you for reading!
The Syncfusion Vue UI components library is the only suite you will ever need to build an app. It contains over 65 high-performance, lightweight, modular, and responsive UI components in a single package.
For questions, you can contact us through our support forum, support portal, or feedback portal. We are always happy to assist you!
