After some interaction with Microsoft’s universal Windows apps, we did some comparisons with our universal controls and found that we have succeeded in creating many real-time universal applications. Those samples are now showcased in our studio. Let’s tour one of our showcased samples: the Patient Monitor.
Patient Monitor
The Patient Monitor demo is a real-time use case application for doctors to monitor the condition of their patients in the hospital. A doctor needs to frequently monitor patients via phone, tablets, or PC. In this scenario, a single application that can run on all Windows devices is more effective for the doctor than using different applications for different devices.
The home page is the first page of the sample and contains tiles of patients, including details about the patients and their appointments. Diagrammatic representation is more effective and easy to understand, so we have incorporated an ECG report using universal chart controls. Using the GridView control, the hub tiles are arranged and modified with item template to show the patients’ details.
We have created some user controls in the home page to achieve different views for WinRT and Windows Phone:
- HubView
- MapView
- EventView
- CalendarView
HubView
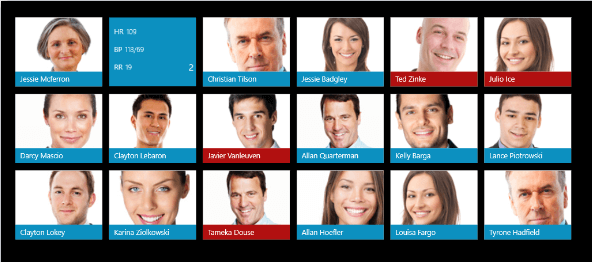
Represents a collection of details in a gallery view, which is an elegant way to display and navigate. To achieve this, Syncfusion provides a sophisticated UI control called HubTile. We have different ways to place our control in the devices that can adapt both views. One of the ways is by using user control with different styles for windows and Windows Phone view. Here, we have designed GridView, which contains the list of items source of patient details. Each tile shows two different contents with the hubtiletransition animation. The primary content shows the patient’s identity, and secondary content shows the ECG details.
Clicking the tile navigates to corresponding chart page with an ECG and history report of the patient.
In WinRT:
In Windows Phone:

Code Sample
<gridview x_name="gridview" grid.row="1" horizontalalignment="Left" margin="0,47,0,-17" verticalalignment="Center" width="1000" background="{x:Null}" isitemclickenabled="True" itemclick="ItemGridViewItemClick1" itemtemplate="{StaticResource HubViewTemplate}" itemssource="{Binding Source={StaticResource GroupedItemsViewSource}}" padding="0" scrollviewer.horizontalscrollbarvisibility="Disabled" scrollviewer.verticalscrollbarvisibility="Disabled" selectionmode="None">

            <gridview.itemspanel>
                <itemspaneltemplate>
                    <variablesizedwrapgrid verticalalignment="Stretch" itemheight="225" height="700" itemwidth="225" margin="0 0 0 10" maximumrowsorcolumns="4" orientation="Horizontal"></variablesizedwrapgrid>
                </itemspaneltemplate>
            </gridview.itemspanel>
        </gridview>
ChartPage
There is no better way to represent data than a chart, and Syncfusion’s universal chart control helps build this page in an elegant way by allowing you to customize the control. The purpose of chart control here is to visualize cardiac reports like ECG and patient history.
Current Details View
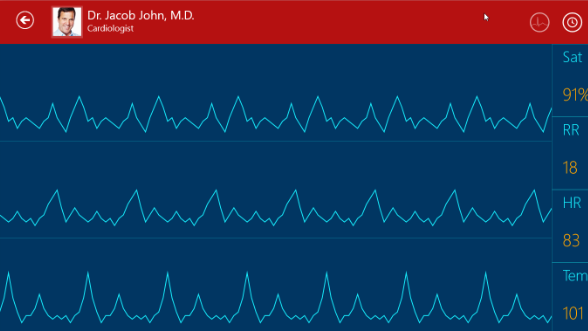
It is difficult to carry around an ECG device, but for monitoring purposes doctors need updated ECG details of the each patient at all times. For convenience it is optimal to have an application that is similar to an ECG monitor that can be used on multiple devices with equal functionality. Syncfusion’s universal Windows app controls can help create an application that runs on all Windows devices. This is achieved with the help of a separate theme file chart control that can stretch and fit the available space.To display ECG data updates accurately and fast, we need a chart control that responds to fast values generated by ECG device, such as the Syncfusion universal fast line series.
In WinRT:
In Windows Phone:

Code Sample
<chart:sfchart x_name="PatientRandom">
   <chart:fastlineseries itemssource="{Binding RandomData}" interior="#17EBFC" xbindingpath="X" ybindingpath="Y"></chart:fastlineseries>
       <chart:fastlineseries itemssource="{Binding RandomData2}" interior="#17EBFC" xbindingpath="X" ybindingpath="Y">
       <chart:fastlineseries.yaxis>
           <chart:numericalaxis visibility="Collapsed" showgridlines="False" chart:sfchart.row="1" majorgridlinestyle="{StaticResource GridLineStyle}" plotoffset="30" interval="4" minimum="0" maximum="20"></chart:numericalaxis>
       </chart:fastlineseries.yaxis>
           </chart:fastlineseries>
           <chart:fastlineseries itemssource="{Binding RandomData3}" interior="#17EBFC" xbindingpath="X" ybindingpath="Y">
  <chart:fastlineseries.yaxis>
           <chart:numericalaxis visibility="Collapsed" showgridlines="False" chart:sfchart.row="2" majorgridlinestyle="{StaticResource GridLineStyle}" plotoffset="30" interval="4" minimum="0" maximum="20"></chart:numericalaxis>
           </chart:fastlineseries.yaxis>
       </chart:fastlineseries>
</chart:sfchart>
History Details View
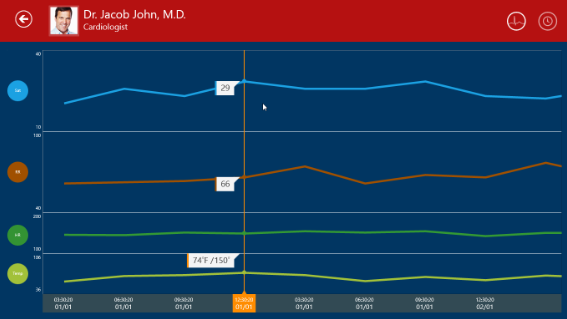
Traditionally, ECG history is stored on paper. Syncfusion universal app controls help the environment by storing and displaying data in a single compact chart view, replacing lengthy paper reports. With the help of separate theme file chart control, charts can be displayed accurately on different Windows devices.
Code Sample
<chart:fastlineseries trackballlabeltemplate="{StaticResource trackBallLabel}" itemssource="{Binding HealthDetails}" interior="#FF68CBE1" xbindingpath="DateTime" ybindingpath="Sat" strokethickness="5">
   </chart:fastlineseries>
<chart:scatterseries trackballlabeltemplate="{StaticResource trackBallLabel}" itemssource="{Binding HealthDetails}" xbindingpath="DateTime" ybindingpath="Sat" scatterwidth="16" strokethickness="2" stroke="#013662" scatterheight="16" interior="#FF68CBE1">
</chart:scatterseries>
MapView
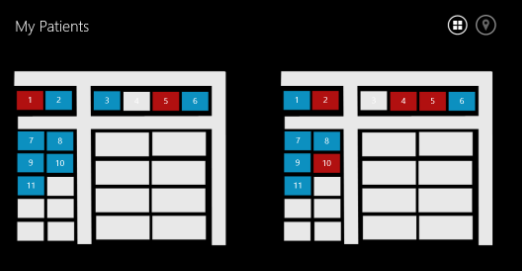
In a hospital scenario, it is easier to identify patients by their location rather than their name. Those not familiar with our highly customizable Maps control may wish to start developing a control that meets this requirement. Generally the Maps control is used to represent the geographic pattern of the earth, but unbeatable customization support from Syncfusion allows you to create custom maps as well. In the following image, our Maps control provides a visual representation of the patient’s location in the hospital using a custom shapes file.
Code Sample
The following code shows how to create ShapeFileLayers to customize the Map:
<syncfusion:shapefilelayer x_name="shapelayer" background="Transparent" enableselection="True" shapeidpath="RoomNo" shapeidtablefield="RoomNo" uri="ms-appx:///Assets/ShapeFiles/block one.shp">

       <syncfusion:shapefilelayer.itemstemplate>
           <datatemplate>
  <grid width="62" height="42" background="Transparent”        PointerPressed=" navigatetocurrentdetail"="">
   <textblock horizontalalignment="Center" verticalalignment="Center" fontsize="20" foreground="White" text="{Binding Data.RoomNo}"></textblock>
</grid>
</datatemplate>
</syncfusion:shapefilelayer.itemstemplate>
</syncfusion:shapefilelayer>
CalendarView
Every day we keep track of different events happening in the world, and we often use text pads to maintain appointments. Syncfusion Calendar control customization provides an excellent way to note these appointments easily and efficiently. Our universal Calendar supports different styles for the calendar view by modifying the themes in Windows and Windows Phone.
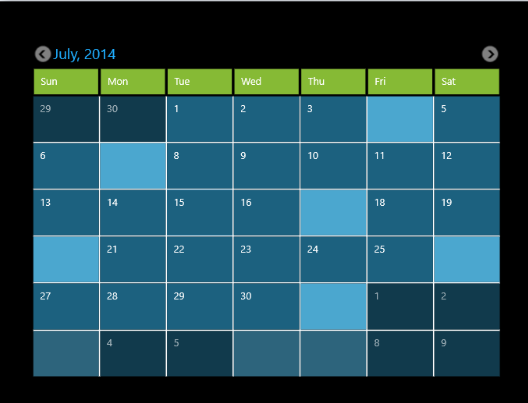
Code Sample
In WinRT:
<datatemplate x_key="AppoitmentTemplate">
            <border>
   <notification:sfhubtile ishittestvisible="False" background="#4BA7CF" padding="1" imagesource="{Binding Converter={StaticResourceImageSourceConverter}, ConverterParameter={StaticResourceeventsViewModel}}" interval="{Binding Converter={StaticResourceIntervalConverter}, ConverterParameter={StaticResourceeventsViewModel}}">
       <notification:sfhubtile.secondarycontent>
           <stackpanel orientation="Vertical">
  <textblock margin="10" fontsize="15" foreground="White" text="{Binding Converter={StaticResource DateConverter}}"></textblock>
  <textblock margin="10,0,0,0" foreground="White" text="{Binding Converter={StaticResourceTitleConverter},ConverterParameter={StaticResource eventsViewModel}}" texttrimming="WordEllipsis"></textblock>
           </stackpanel>
       </notification:sfhubtile.secondarycontent>
       <notification:sfhubtile.hubtiletransitions>
           <notification:hubtiletransitioncollection>
  <controls:slidetransition></controls:slidetransition>
</notification:hubtiletransitioncollection></notification:sfhubtile.hubtiletransitions></notification:sfhubtile></border></datatemplate>
In Windows Phone:
<datatemplate x_key="Celltemplate">
            <grid>
   <textblock text="{Binding Converter={StaticResource Converter}, ConverterParameter={StaticResource events}}" <="">VerticalAlignment="Top" HorizontalAlignment="Right" Foreground="White" Margin="3" FontSize="6" TextWrapping="Wrap"/>

   <textblock text="{Binding Day}" fontsize="18" verticalalignment="Bottom" foreground="White" margin="3"></textblock>

            </textblock></grid>
       </datatemplate>
Sample Application: PatientMonitorDemo.zip (1.84 mb)
Content Contributor: Selva Ganapathy K.
Content Editor: Usha Clementine

Comments (2)
Your work is inspiring, I am trying to carry out a similar project based on .net maui using Google’s firebase serverless database
Great! If you have any issues, feel free to ask.