The Essential JavaScript Spreadsheet, also known as the JavaScript Excel viewer, is a feature-rich control for organizing and analyzing data in tabular format. It supports all the common Excel features, including data binding, selection, editing, formatting, resizing, sorting, importing, and exporting Excel documents. In this blog post, we will look at the freeze panes feature in the JavaScript Spreadsheet.
Freeze panes
This feature helps us lock the visibility of particular rows or columns when we scroll the worksheet horizontally or vertically. This is useful if you want to keep the header rows or columns always visible.
Frozen rows
This feature allows you to keep a certain number of rows visible while scrolling vertically through the rest of the worksheet. Freezing the first row is commonly used to keep visible the row header of the data visible. It is especially helpful when working with a large volume of data.
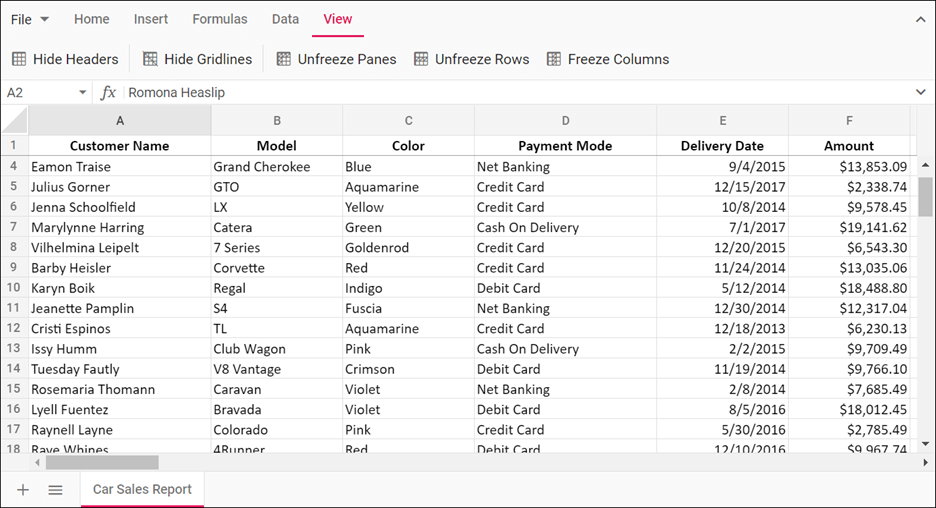
The following screenshot showcases a frozen row in a spreadsheet.

Frozen columns
With this feature, you can keep a certain number of columns visible while scrolling horizontally through the rest of the worksheet. Freezing the first column is commonly used to keep the column header of the data visible.
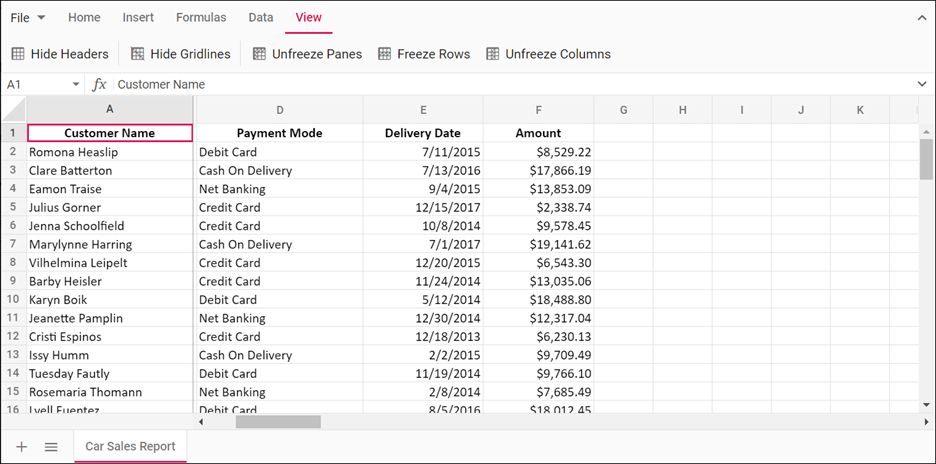
The following screenshot showcases a frozen column in a spreadsheet.

Adding freeze panes in the JavaScript Spreadsheet through codes
You can add the freeze panes feature through codes by using the frozenRows and frozenColumns properties in the sheet object and the freezePanes public method. Then, pass the row and column index with this method.
The following code example shows how to add the freeze panes feature in the Spreadsheet.
import { Spreadsheet } from '@syncfusion/ej2-spreadsheet';
import * as dataSource from './freeze-pane-data.json';

/**
 * Freeze panes sample
 */
    let spreadsheet: Spreadsheet = new Spreadsheet({
        sheets: [
            {
                name: 'Gross Salary',
                ranges: [{ dataSource: (dataSource as any).defaultData, startCell: 'A2' }],
                rows: [
                    {
                        cells: [
                            {
                                index: 1, value: 'Period', style: {
                                    fontSize: '12pt', fontWeight: 'bold',
                                    textAlign: 'center', verticalAlign: 'middle'
                                }
                            },
                            {
                                index: 3, value: 'Total Gross Salary', style: {
                                    fontSize: '12pt', fontWeight: 'bold',
                                    textAlign: 'center', verticalAlign: 'middle'
                                }
                            },
                        ]
                    },
                    {
                        index: 26,
                        cells: [
                            {
                                index: 13, value: 'Total Amount', style: {
                                    fontSize: '12pt', fontWeight: 'bold',
                                    textAlign: 'center', verticalAlign: 'middle'
                                }
                            },
                            {
                                formula: '=SUM(O4:O26)', style: {
                                    fontSize: '12pt', fontWeight: 'bold', textAlign: 'center',
                                    verticalAlign: 'middle'
                                }
                            },
                            {
                                formula: '=SUM(P4:P26)', style: {
                                    fontSize: '12pt', fontWeight: 'bold', textAlign: 'center',
                                    verticalAlign: 'middle'
                                }
                            },
                        ]
                    }
                ],
                columns: [
                    { width: 80 }, { width: 80 }, { width: 100 }, { width: 100 },
                    { width: 100 }, { width: 100 }, { width: 100 }, { width: 100 },
                    { width: 100 }, { width: 100 }, { width: 100 }, { width: 100 },
                    { width: 80 }, { width: 100 }, { width: 100 }, { width: 100 }
                ],
                selectedRange: 'C1',
                // Specifies the number of frozen rows
                frozenRows: 2,
                // Specifies the number of frozen columns
                frozenColumns: 2
            }],
        created: (): void => {
            spreadsheet.wrap('C2:P2');
            spreadsheet.merge('A1:B1');
            spreadsheet.merge('C1:P1');
            spreadsheet.cellFormat({ backgroundColor: '#4e4ee6', color: '#FFFFF4', fontSize: '12pt', fontWeight: 'bold'}, 'A1:P2');
            spreadsheet.cellFormat({textAlign: 'center', verticalAlign: 'middle'}, 'A1:P2');
            spreadsheet.cellFormat({ backgroundColor: '#4e4ee6', color: '#FFFFF4' }, 'A3:B26');
            spreadsheet.numberFormat('$#,##0.00', 'C2:P26');
            spreadsheet.numberFormat('$#,##0.00', 'O27:P27');
        }
    });

    spreadsheet.appendTo('#spreadsheet');
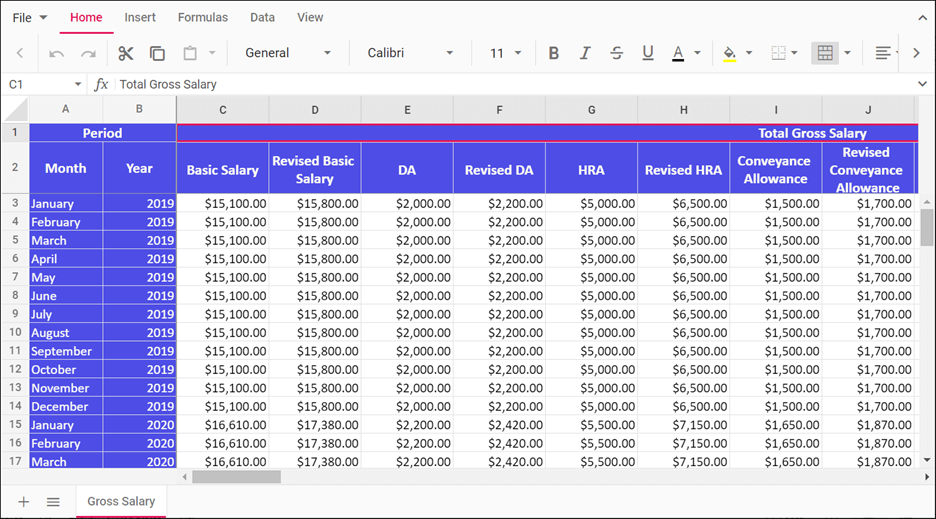
Refer to the following screenshot.

Reference
For more details, refer to the Freeze Panes in JavaScript Spreadsheet demos.
Conclusion
I hope you now have a better understanding of the freeze panes feature in the JavaScript Spreadsheet control. Please share your thoughts about it in the comments section below.
Our Spreadsheet control is also available in our ASP.NET ( Core, MVC, Web Forms), Angular, JavaScript, React, Vue, UWP, WPF, and WinForms platforms. Use it for seamless data analysis and visualization!
If you are already a Syncfusion user, you can download the Essential Studio® for JavaScript product setup to try out this control. Otherwise, you can download a free 30-day trial.
If you have any questions about these features, please contact us through our support forum, Direct-Trac, or feedback portal. We are always happy to assist you!
