Syncfusion Angular Data Grid is used to display data in a tabular format. Its rich functionalities include data binding, editing, Excel-like filtering, custom sorting, grouping, row reordering, freezing rows and columns, aggregating rows, and exporting to Excel, CSV, and PDF formats.
In this blog post, we are going to discuss how to load more than a million records in less than a second in Syncfusion Angular Data Grid.
Let’s get started!
What is virtual scrolling and why do we need it?
Consider, you have more than a million records, and you want to display them in a scrollable grid and not in pages. Loading millions of records will take a lot of time in any browser, which will result in deterioration in performance. It will also pollute the DOM (Document Object Model) and consume a lot of memory.
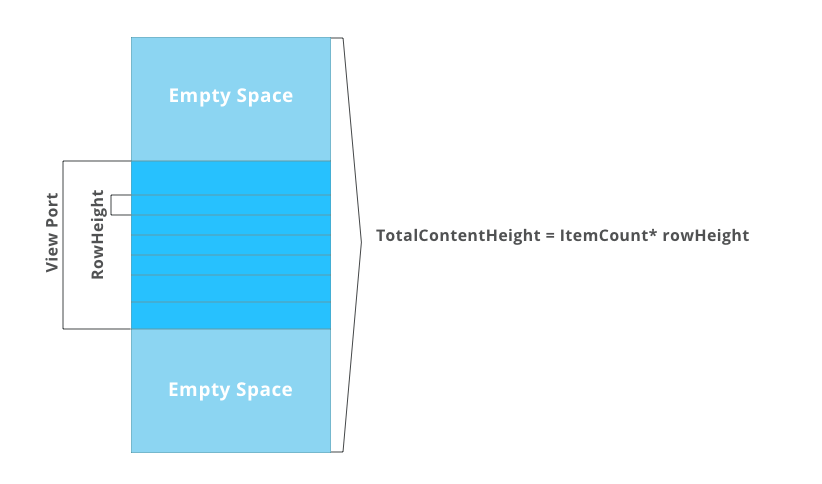
With virtual scrolling, instead of rendering all the data at a time, you can render a subset of the data that fits on the screen (plus a small buffer). All the other data can be shown through top and bottom padding elements. These elements are empty spaces but have some height, which is calculated from the items count and row node height. This is necessary to provide consistent scrollbar parameters. So, when the user navigates, a new subset of items is calculated and the content is rebuilt, the old is hidden, and the padding elements are recalculated.


Syncfusion Angular components are:
- Lightweight
- Modular
- High-performing
Steps to load millions of records in Angular Data Grid
Step 1: Set up Angular environment.
Use the Angular CLI to set up your Angular environment. To install the Angular CLI, use the following command.
npm install -g @angular/cli |
Step 2: Create an Angular application.
Create a new Angular application using the following Angular CLI command.
ng new my-app |
Step 3: Add the Syncfusion grids package.
All the Essential JS 2 NuGet packages are available in the npmjs.com registry.
To install the Data Grid component, use the following command.
npm install @syncfusion/ej2-angular-grids --save |
The —save will instruct the NPM to include the grids package inside of the dependencies section of the package.json.
Step 4: Register Grid module.
Import the Grid module into the Angular application (app.module.ts) from the package @syncfusion/ej2-angular-grids [src/app/app.module.ts].
Refer to the following code.
import { NgModule } from '@angular/core';
import { BrowserModule } from '@angular/platform-browser';
// import the GridModule for the Grid component
import { GridModule } from '@syncfusion/ej2-angular-grids';
import { AppComponent }  from './app.component';

@NgModule({
  //declaration of ej2-angular-grids module into NgModule
  imports:      [ BrowserModule, GridModule ],
  declarations: [ AppComponent ],
  bootstrap:    [ AppComponent ]
})
export class AppModule { }
Step 5: Add CSS reference.
The following CSS files are available in the ../node_modules/@syncfusion package folder. Add the reference to these CSS files in styles.css[src/styles.css] using the following code.
@import '../node_modules/@syncfusion/ej2-base/styles/material.css';
@import '../node_modules/@syncfusion/ej2-buttons/styles/material.css';
@import '../node_modules/@syncfusion/ej2-calendars/styles/material.css';
@import '../node_modules/@syncfusion/ej2-dropdowns/styles/material.css';
@import '../node_modules/@syncfusion/ej2-inputs/styles/material.css';
@import '../node_modules/@syncfusion/ej2-navigations/styles/material.css';
@import '../node_modules/@syncfusion/ej2-popups/styles/material.css';
@import '../node_modules/@syncfusion/ej2-splitbuttons/styles/material.css';
@import '../node_modules/@syncfusion/ej2-angular-grids/styles/material.css';
Step 6: Add the Data Grid component
Modify the template in the [src/app/app.component.html] file to render the grid component. Add the Angular Data Grid by using the <ejs-grid> selector and button element to load the data.
Refer to the following code.
<div class='div-button'>
  <button (click)='onClick($event)'>Load 1 Million Data</button>
  <span id="performanceTime">Time Taken: 0 ms</span>
</div>
<ejs-grid #grid [dataSource]='vData' [enableVirtualization]='true' [enableColumnVirtualization]='true' height='600' (dataBound)='dataBound()'>
  <e-columns>
      <e-column field='FIELD1' headerText='Player Name' width='120'></e-column>
      <e-column field='FIELD2' headerText='Year' width='100'></e-column>
      <e-column field='FIELD3' headerText='Stint' width='120'></e-column>
      <e-column field='FIELD4' headerText='TMID' width='120'></e-column>
      <e-column field='FIELD5' headerText='LGID' width='120'></e-column>
      <e-column field='FIELD6' headerText='GP' width='120'></e-column>
      <e-column field='FIELD7' headerText='GS' width='120'></e-column>
      <e-column field='FIELD8' headerText='Minutes' width='120'></e-column>
      <e-column field='FIELD9' headerText='Points' width='130'></e-column>
      <e-column field='FIELD10' headerText='OREB' width='130'></e-column>
      <e-column field='FIELD11' headerText='DREB' width='130'></e-column>
      <e-column field='FIELD12' headerText='REB' width='130'></e-column>
      <e-column field='FIELD13' headerText='Assists' width='130'></e-column>
      <e-column field='FIELD14' headerText='Steals' width='120'></e-column>
      <e-column field='FIELD15' headerText='Blocks' width='120'></e-column>
      <e-column field='FIELD16' headerText='Turnovers' width='140'></e-column>
      <e-column field='FIELD17' headerText='PF' width='100'></e-column>
      <e-column field='FIELD18' headerText='FGA' width='150'></e-column>
      <e-column field='FIELD19' headerText='FGM' width='120'></e-column>
      <e-column field='FIELD20' headerText='FTA' width='150'></e-column>
      <e-column field='FIELD21' headerText='FTM' width='120'></e-column>
      <e-column field='FIELD22' headerText='Three Attempted' width='170'></e-column>
      <e-column field='FIELD23' headerText='Three Made' width='140'></e-column>
      <e-column field='FIELD24' headerText='Post GP' width='120'></e-column>
      <e-column field='FIELD25' headerText='Post GS' width='120'></e-column>
      <e-column field='FIELD26' headerText='Post Minutes' width='150'></e-column>
      <e-column field='FIELD27' headerText='Post Points' width='120'></e-column>
      <e-column field='FIELD28' headerText='Post OREB' width='150'></e-column>
      <e-column field='FIELD29' headerText='Post DREB' width='150'></e-column>
      <e-column field='FIELD30' headerText='Post REB' width='150'></e-column>
  </e-columns>
</ejs-grid>
In the previous grid settings, we have enabled the row and column virtualizations to virtualize data in vertical and horizontal scrolling using the enableVirtualization and enableColumnVirtualization properties.
Note: To set up the row virtualization, you need to set the content height using the height property.
Step 7: Bind 1 million generated data points to Data Grid.
In the button click event, we have generated 1 million data points from the data.ts file, which uses loop, and then bound this data to the data grid using the dataSource property. Once data is bound to the grid, the dataBound event will be invoked.
Refer to the following code.
import { Component, OnInit, ViewEncapsulation, ViewChild } from '@angular/core';
import { GridComponent } from '@syncfusion/ej2-angular-grids';
import { datasource, virtualData } from './data';
@Component({
  selector: 'app-root',
  templateUrl: './app.component.html',
  styleUrls: ['./app.component.css']
})
export class AppComponent implements OnInit {
  public vData: Object[] = virtualData;
    @ViewChild('grid')
    public grid: GridComponent;
    public date1: number;
    public date2: number;
    public flag: boolean = true;
    public ngOnInit(): void { }

    onClick = (args: any) => {
        if (!this.vData.length) {
             datasource();
            this.grid.dataSource = this.vData;
        }
        this.flag = true;
        this.date1 = new Date().getTime();
        this.grid.refresh();
    }
    dataBound(): void {
        if (this.flag && this.date1) {
            this.date2 = new Date().getTime();
            document.getElementById('performanceTime').innerHTML = 'Time Taken: ' + (this.date2 - this.date1) + 'ms';
            this.flag = false;
        }
    }
}

Be amazed exploring what kind of application you can develop using Syncfusion Angular components.
Step 8: Module injection.
To customize the grid with some additional features, inject the required modules. Extend the grid’s basic functionality with the VirtualScrollService module, a provider for using the virtual scrolling feature. This module should be injected into the provider’s section of the root NgModule or component class.
Step 9: Run the application
Use the following command to run the application in the browser.
ng serve –open |
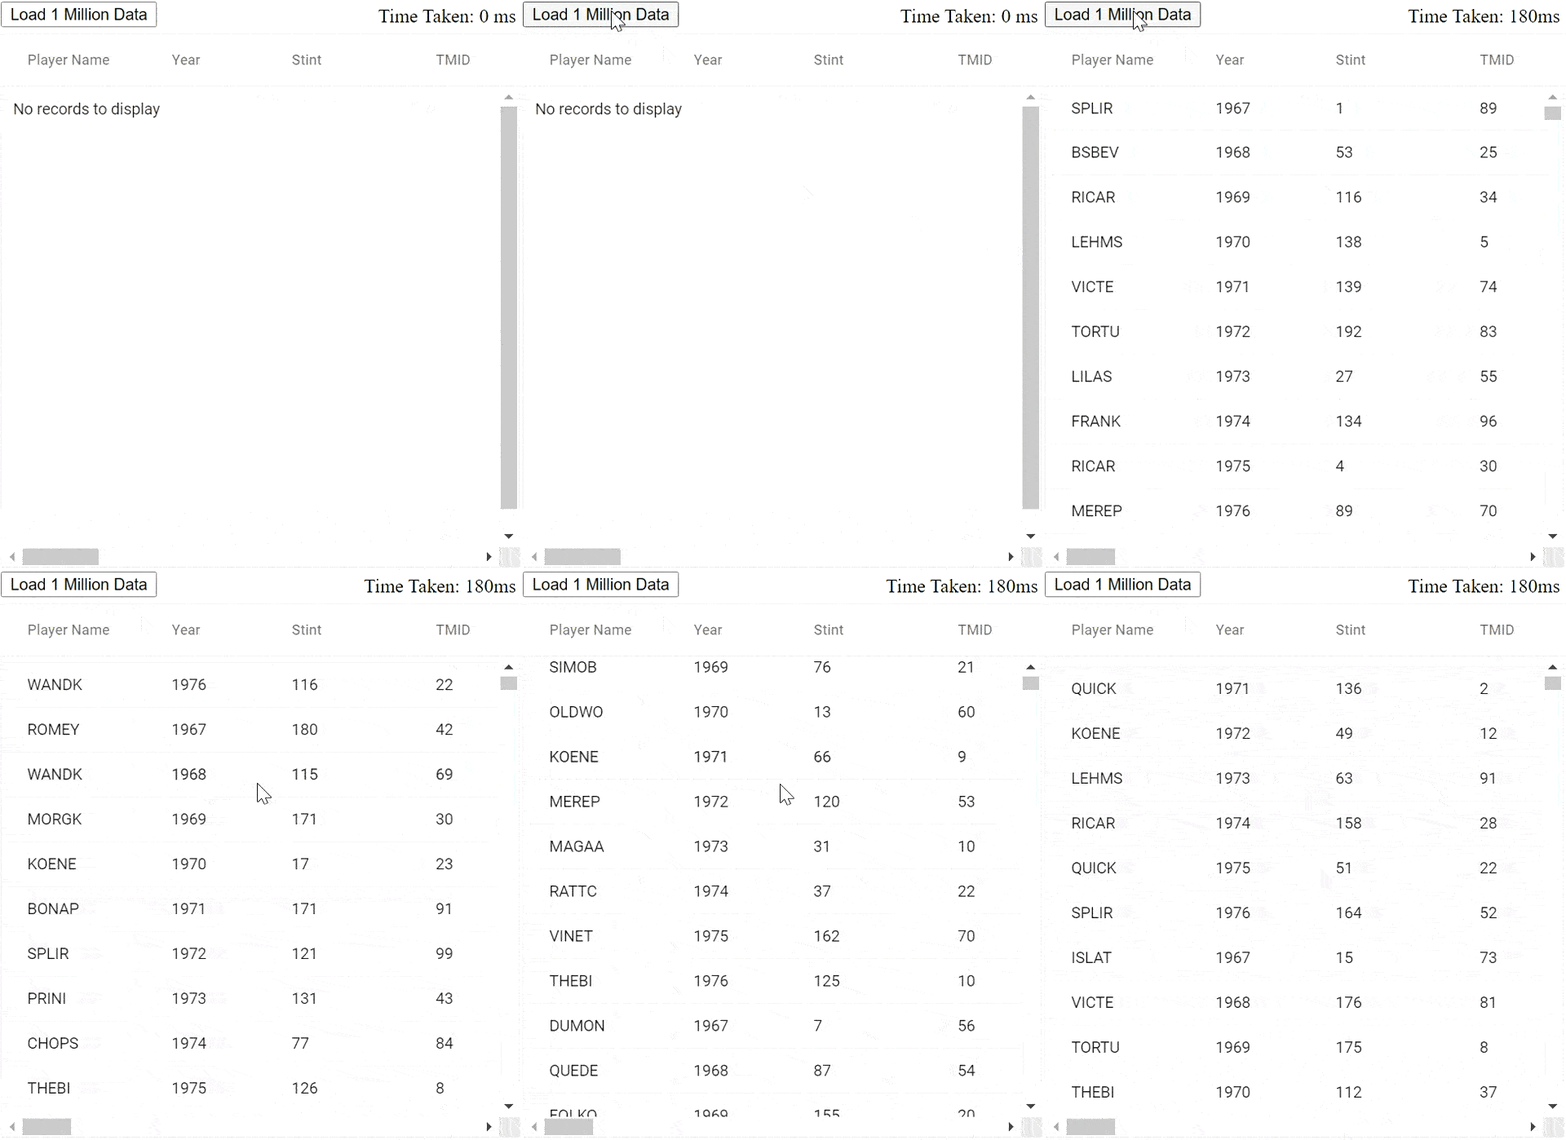
The output will appear as shown in the following .gif image.

GitHub reference: You can check out our project samples in this GitHub repository. Harness the power of Syncfusion’s feature-rich and powerful Angular UI components.

Conclusion
In this blog, we have seen how easy it is to load millions of data points in less than a second without any performance lag in the Syncfusion Angular Data Grid. This feature will reduce the loading time and memory space required. The DataGrid control is available in our Syncfusion ASP .NET (Core, MVC, Web Forms), Blazor, JavaScript, React, Vue, Flutter, Xamarin, UWP, WinForms, and WPF platforms, too.
So, feel free to try them out and share your feedback or questions in the comments section below.
For Angular developers, Syncfusion provides over 65+ high-performance, lightweight, modular, and responsive Angular components to speed up your development.
You can also contact us through our support forum, support portal, or feedback portal. We are always happy to assist you!

Comments (8)
Does the same example available for Vue ?
Yes, We can create the same example in Vue framework also. For your convenience, we have created the same sample in Vue and you can download the sample using the following link.
Sample: https://www.syncfusion.com/downloads/support/directtrac/general/ze/grid_virtualization_vue1996175038.zip
Getting started Documentation: https://ej2.syncfusion.com/vue/documentation/grid/getting-started/
Do you have a similar sample in MVC?
While we doing this i could not able to do the grid inline dropdown edit.
Other that to test the abilities of a certain tool, why would anyone want to load a million records into some type of data view?
Using the Syncfusion infinite scrolling feature, we can render simple data/tabular view or custom cell design using template feature, and also we can use rich features like Sorting, Filtering, Searching, CRUD, etc. Please refer to the following examples for real-time use cases for loading millions of data in Grid view.
• Facebook posts
• Twitter tweets
• Ecommerce websites like Amazon
• Streaming websites like Netflix
• Banking sector
• Government data, etc.
Also, please refer the below link for simple cell design with infinite scrolling feature.
https://www.syncfusion.com/blogs/wp-content/uploads/2020/08/JS2-DataGrid-infinite-scrolling-with-templates.gif
I append this code to my angular project, but its taking more time comparing to example .
Any reason
In virtualization, we load and render the DOM element only for a subset of data into the viewport based on the initial rendering or scroll action. When we perform scrolling in Grid, we send a request to get the data from the server and there will be considerable time to fetch data from the database. So please make sure whether your service returned the data quickly from server request or if it is local data, ensure data generation time.