Popular Categories.NET (231)
.NET Core (28)
.NET MAUI (360)
Angular (165)
ASP.NET (48)
ASP.NET Core (91)
ASP.NET MVC (85)
Azure (53)
Black Friday Deal (2)
Blazor (351)
BoldSign (20)
Desktop (795)
DocIO (24)
Essential JS 2 (117)
Essential Studio (216)
File Formats (124)
Flutter (181)
JavaScript (272)
Microsoft (128)
PDF (137)
Python (1)
React (192)
Streamlit (1)
Succinctly series (131)
Syncfusion (1138)
TypeScript (34)
Uno Platform (3)
UWP (3)
Vue (55)
Webinar (75)
Windows Forms (59)
WinUI (81)
Word (31)
WPF (203)
Xamarin (159)
XlsIO (40)
Other Categories.NET 10 (5)
.NET 10 feature (1)
.NET 9 (1)
.NET Desktop Applications (1)
.NET development (14)
.NET MAUI List View (1)
.NET MAUI PDF Viewer (1)
.NET Optimization (1)
.NET PDF Library (5)
.NET Tools (1)
.NET UI Components (1)
Accessibility (1)
Accounting and Finance (1)
AI (20)
AI and Machine Learning (2)
AI Coding (1)
AI Coding Assistant (2)
AI Coding Tools (1)
AI in Development (7)
AI in Software Development (5)
AI in Web Development (4)
AI Summarization (1)
AI-Powered Components (2)
AI-powered Diagramming (1)
AI-Powered Smart Controls (2)
AI/Machine Learning (2)
Angular 17 Features (1)
Angular 19 (1)
Angular Circular Gauge (1)
Angular Migration (1)
Angular UI Components (1)
Angular Word Processor (1)
Annotation Control (1)
Annotations (1)
App Development (2)
Artificial Intelligence (3)
ASP.NET Core APIs (1)
Async LINQ (1)
AWS S3 Integration (1)
Azure Integration (1)
Backend Services (1)
Barcode (5)
Best Data Grid for React (1)
Best React Data Grid (1)
Best React Data Grid Component (1)
Best React Data Grid Library (1)
Best React Data Table (1)
Best React Grid (1)
Best React Table Library (1)
BI (30)
BI Tools (1)
Blazor Charts (2)
Blazor Components (2)
Blazor Development (8)
Blazor Rich Text Editor (1)
Blazor Spline Chart (1)
Blazor Spreadsheet (1)
Block Editor (2)
Bold BI (11)
Bold Reports (4)
Budgeting Tool (1)
Build conference (12)
Business intelligence (59)
Business Tools (2)
Button (4)
C# (199)
Calendar Customization (1)
Chart (250)
Chart Legends (1)
Chart Library (1)
Chart of the week (134)
Charts (8)
Chatbots (1)
ChatGPT (1)
CI/CD (1)
Circular Charts (1)
Circular Gauge (1)
Client-Side Rendering (1)
Cloud (20)
Cloud Computing (1)
Cloud Deployment (2)
Cloud File Management (1)
Cloud Monitoring (2)
Cloud Storage (1)
Code Generation (1)
Code Studio (8)
Company (439)
Company Culture (1)
Conference (2)
Convert MVC view to PDF (1)
Convert Razor page to PDF (1)
Convert webpage to PDF (1)
Corporate wellness (1)
Cricket Analytics (1)
Cross-Platform Development (20)
Cross-Platform Frameworks (2)
Cross-Platform UI (2)
CRUD Operations (1)
Custom Functions In Excel (1)
Dashboard (17)
Data Analytics (3)
Data Management (6)
Data Science (3)
Data Validation (11)
DataGrid (93)
Desktop Development (3)
Developer Best Practices (1)
Developer Productivity (14)
Developer Tools (17)
Development (874)
Diagram (7)
Diagramming Libraries (1)
Diagramming Tools (6)
Digital Document Standards (1)
Doc (8)
Docker Deployment (2)
Docker image (2)
DockingManager (1)
Document Automation (5)
Document Compliance (1)
Document Editing (1)
Document Editing Tools (1)
Document Management (8)
Document Processing APIs (1)
Document Processing Library (3)
Document SDKs (3)
Document Viewer (2)
Document Workflow Optimization (1)
Documentation Workflow (1)
DOCX Editor (3)
Doughnut Charts (1)
Drill-Down Charts (1)
eBook (99)
EJ2 (1)
Embed PDFs in HTML (1)
Employee success stories (1)
Enterprise (23)
Enterprise Tools (1)
Entity Framework (7)
Environmental Tech (1)
Essential Tools (13)
Events and Celebrations (1)
Excel (62)
Excel Automation (3)
Excel in React (1)
Excel Processing (2)
Excel-like Spreadsheet (2)
Excel-Like UI (1)
Expense Tracker (1)
Extensions (36)
File Format Libraries (4)
File Manager (11)
Financial Analytics (1)
Financial App Development (1)
Financial Apps (1)
Financial Charting (2)
Financial Tech (1)
Fintech App Development (1)
Flutter Charts (1)
Flutter development (1)
Form Designer (1)
Free PDF tools (4)
Free Software (2)
Free VS Code Extension (1)
Frontend Architecture (1)
Frontend development (15)
Frontend UI Design (1)
Gantt (29)
Gantt Chart (3)
Gantt Chart Integration (2)
Gauge (14)
Gemini API (1)
Git (6)
GitHub Copilot (3)
GitHub Copilot Extension (1)
Global Teams (1)
Google Maps Integration (1)
Grid (35)
GridView (1)
gRPC Streaming (1)
HR Dashboard (1)
HTML (18)
HTML Editor (3)
HTML PDF Viewer (1)
HTML Sanitization (1)
HTML to PDF (3)
HTML to PDF Conversion (1)
HTML to PDF Tools (1)
HTML to PDF with Blink engine (1)
Installer (2)
Integration tutorials (1)
Intelligent Code Suggestions (1)
Interactive Charts (1)
IoT Interfaces (1)
JavaScript Components (1)
JavaScript Development (1)
JavaScript UI Libraries (1)
Knockout (2)
Kubernetes (1)
Language (1)
Language Updates (1)
Large Language Models (2)
Layered Column Chart (1)
Leadership (1)
Library updates (1)
Licensing & Pricing (1)
Line Chart (1)
LINQ Pad (2)
LINQ Performance (1)
LINQ Tips (1)
Linux (2)
Live Preview (1)
Location-based features (1)
M-Commerce (1)
Machine Learning (2)
Map Control (1)
Markdown Editing (1)
MarkDown Live Editing (1)
Markdown Viewer (1)
MAUI (13)
MAUI Charts (1)
MAUI Development (4)
MAUI ToolKit (1)
Mermaid syntax (2)
Metro Studio (11)
Microsoft Project Integration (1)
Microsoft Visual Studio (1)
Middleware (1)
Migration Guides (1)
Mind Mapping Tools (1)
Mobile (623)
Modern Panel (1)
Multimodal LLMs (1)
Natural Language Processing (2)
Node.js (1)
OLAP server (2)
Online Services (2)
Open source (5)
Open Source Tools (2)
OpenAI GPT Integration (1)
OpenAI integration (2)
OpenAI mind map generator (1)
Orubase (12)
OTP Input (1)
Paging (1)
Partners (22)
PDF Accessibilty (1)
PDF Annotation (2)
PDF Converter (1)
PDF Document Management (4)
PDF Editing (1)
PDF Editor (1)
PDF Extraction (1)
PDF File Splitting (2)
PDF Forms (1)
PDF handling (1)
PDF Libraries (1)
PDF Processing (4)
PDF Productivity Tools (1)
PDF Security (1)
PDF Signature (1)
PDF viewer (80)
PDF Viewer Libraries (3)
PDF.js (1)
Performance (19)
Performance Benchmarking (2)
Personal Finance (1)
PHP (2)
Pie Charts (1)
PivotGrid (5)
PowerPoint (7)
Predictive Analytics (7)
Product Updates (6)
Productivity (3)
Productivity Enhancements (1)
Productivity Features (2)
Productivity Software (1)
Productivity Tools (4)
Programming (2)
Project Management Tools (1)
Prompt Engineering (2)
Pure React Components (3)
React Chart (1)
React Charting Library (1)
React Charts (2)
React Components (1)
React Data Grid (11)
React Data Grid Library (9)
React Data Table (9)
React DataGrid Component (9)
React Development (9)
React Grid (9)
React Grid Library (8)
React IDE Extensions (1)
React Libraries (2)
Reactive Programming (1)
ReactJS (1)
Real-Time Applications (1)
Real-Time Dashboards (2)
Real-Time Data (1)
Release Highlights (2)
Report Server (3)
Reporting (9)
Reporting / Back Office (9)
Responsive Design (1)
REST API Integration (1)
Rich Text Editing (2)
Rich Text Editor (25)
Road Map (12)
Role-Based Access (1)
Rotate PDF (1)
Rotate PDF Doc (1)
Runtime improvement (1)
Schedular Control (1)
Scheduler (62)
SDK enhancement (1)
SDKs and APIs (1)
Secure Document Management (1)
Secure PDF Tools (3)
Security (12)
Semantic Kernel (1)
SfDataGrid (11)
Signature Block (1)
Silverlight (20)
Smart AI components (56)
Sneak Peek (42)
Social Media App (1)
Software Architecture (1)
Software Frameworks (1)
Solution Services (4)
SPA Development (1)
Spark Chart (1)
Sport Analytics (1)
Spreadsheet (19)
Spreadsheet Component (1)
Spreadsheet Development (1)
Spreadsheet Formulas (1)
Spreadsheet Integration (1)
SQL (22)
SQLiteDatabase (1)
Standalone Components (1)
State Management (2)
Statistical Analytics (1)
Stock Chart (3)
Surface (4)
Syncfusion Components (2)
Syncfusion Controls (3)
Syncfusion Product Updates (2)
Syncfusion React MCP Server (1)
Syncfusion Releases (2)
Syncfusion Tools (2)
Syncfusion Widgets (2)
Syncfusion XlsIO (1)
Table Block (1)
Tablets (5)
Technology (3)
Theme (12)
Tips and Tricks (115)
TrailBlazor Conference (1)
Travel Industry Trends (1)
Treemap Chart (1)
UI (593)
UI Component Integration (1)
UI Controls (6)
UI frameworks (2)
UI/UX Design Tools (7)
UI/UX for Developers (1)
UML and System Modeling (1)
UML Diagrams (2)
Uncategorized (62)
Unix (2)
User Experience (1)
User interface (69)
User Interface Development (1)
View and Edit Word Processor (1)
Violin Chart (1)
Visual State Manager (2)
Visual Studio (33)
Visual Studio Code (24)
Visual Studio Code Extension (3)
Volume 3, 2025 (1)
VS Code Extension (2)
VS MarkDown Preview (1)
Vue.js (1)
Weather Forecast (1)
Web (798)
Web App Optimization (1)
Web App Performance (2)
Web App security (1)
Web components (1)
Web Development Best Practices (2)
Web Development Tools (1)
Web Forms (1)
Web Performance (2)
Web Security (1)
Weekly Data Visualization (32)
What's new (447)
Windows 8 (19)
Windows App (2)
Windows Phone (15)
Windows Phone 7 (9)
WinForms Development (1)
WinRT (26)
WinUI Chart (1)
WinUI Development (1)
Wisej Framework (1)
Word Document Processing (1)
Word Editor (2)
Word Processor (6)
Workflow Automation (1)
WPF Development (3)
WPF Diagram (1)
WPF Gantt Control (1)
Xamarin migration (1)
XAML UI (1)
XlsIO Library (2)
XSS Prevention (1)
Chart
Copy RSS feed for this category
11 min read
Nov 6, 2025
Effectively Visualize Data: Add Grids and Charts in JavaScript Pivot Field List
9 min read
Mar 21, 2025
Forecast Stock Trends with AI-Powered Smart .NET MAUI Candle Chart
5 min read
Nov 24, 2025
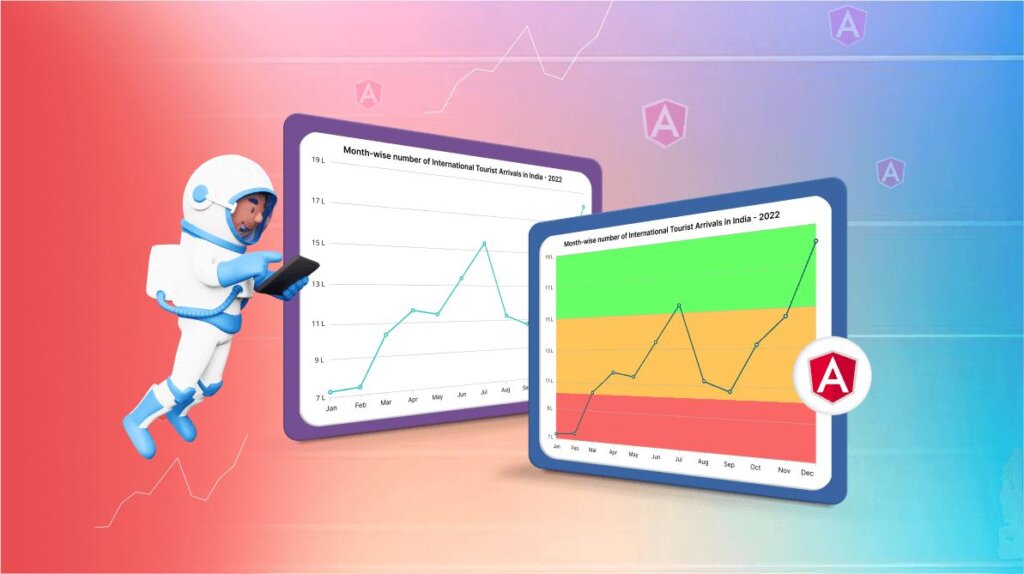
Enhancing Angular Charts: Boosting Readability with Dynamic Colors
11 min read
Nov 18, 2024
React Synchronized Charts: The Perfect Tool to Compare Multiple Datasets
13 min read
Mar 21, 2025
