Our Volume 1, 2015 release introduced a lot of new features for our JavaScript Chart control. Some major highlights were the additions of 100% stacked series, annotations, and trimming for axis titles and labels.
Stacked series
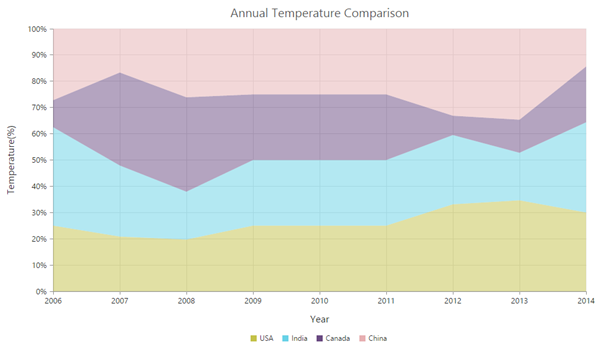
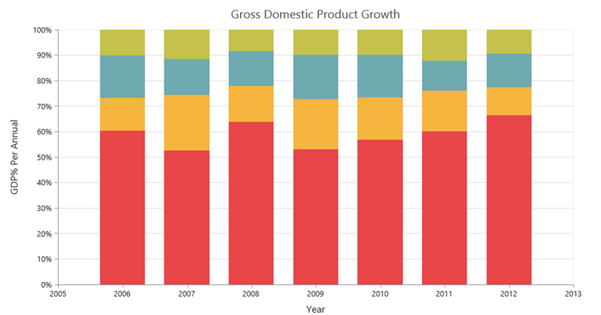
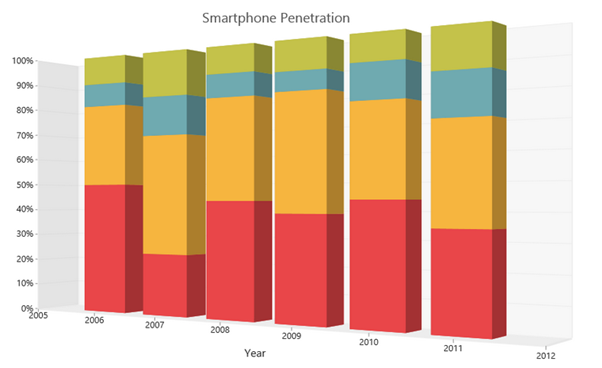
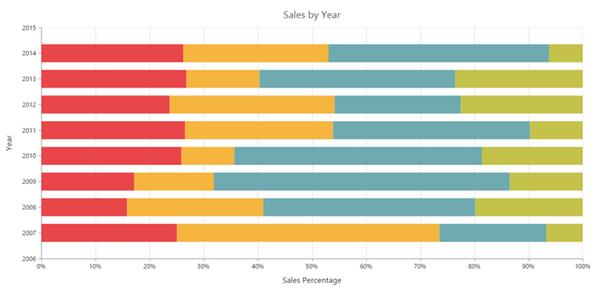
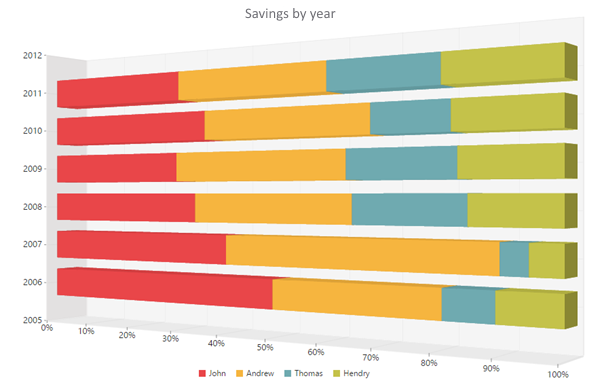
The 100% stacked series gathers the values of all series and stacks them so they account for 100% of something being measured. Chart types include 2-dimensional stacked area, 2- and 3-dimensional stacked column, and 2- and 3-dimensional stacked bar.
Annotations
The annotation functionality allows you to modify charts by placing custom elements at desired positions. Consider the need to watermark a chart; this can now be accomplished through annotations.
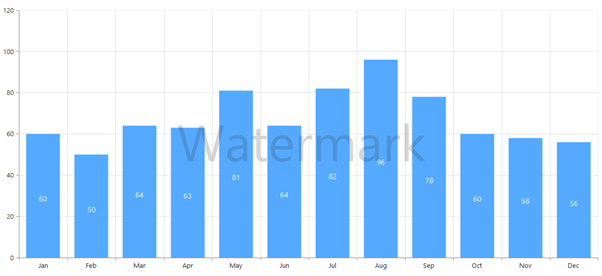
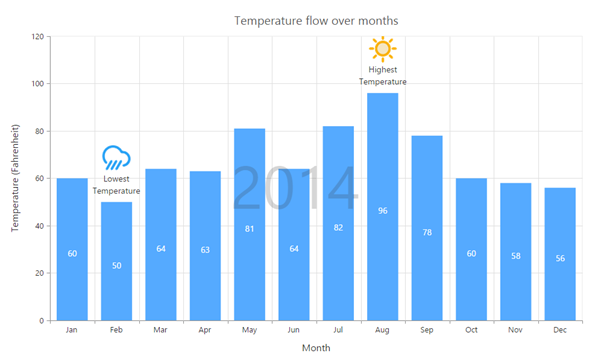
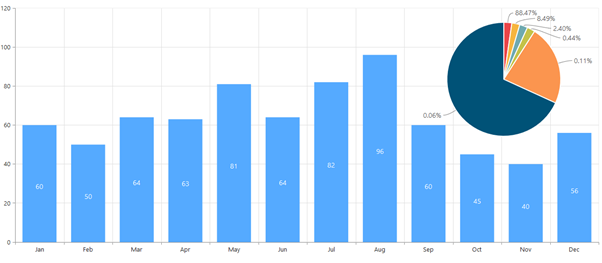
Not only can you add text, but you can also add any HTML element (images, text, controls, etc.) that needs to be displayed over a chart. In the following image, you can see we have annotated the chart with highest and lowest temperatures for the year 2014.
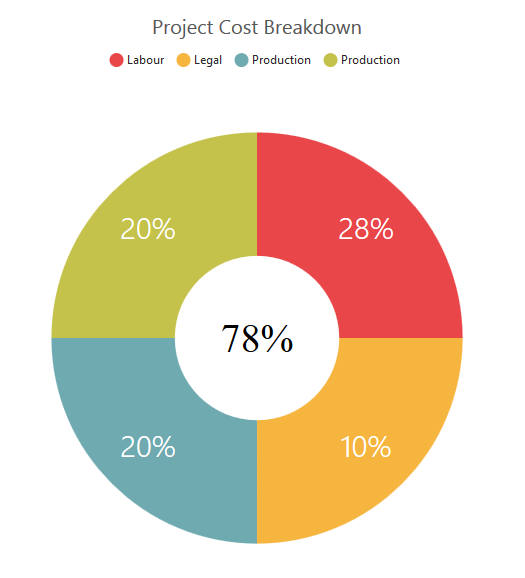
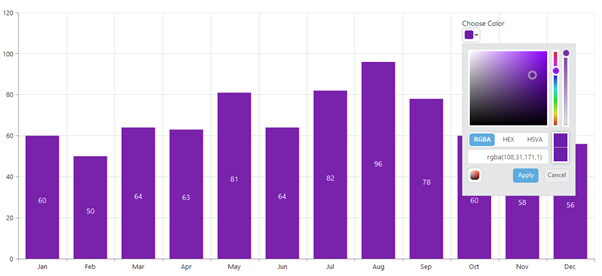
The annotations functionality is very flexible. The following examples showcase this.
Trimming titles and labels
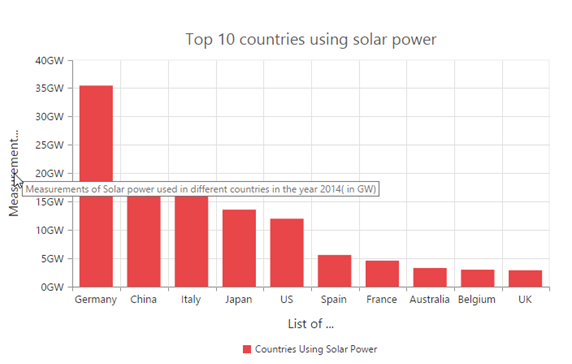
The trimming functionality makes an axis title trim itself when its text length goes beyond the axis.
A tooltip with the full axis title will be displayed when the cursor hovers over the trimmed title.
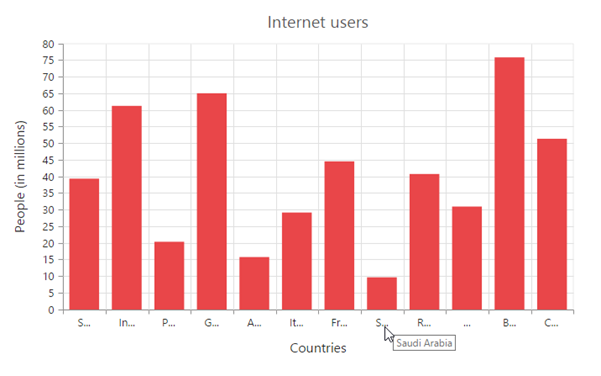
Our chart already supports axis label trimming by showing the full label in a tooltip when the cursor hovers over labels that intersect each other. Now we have extended the support to cases in which labels don’t intersect. All you have to do is to enable axis label trimming and set a width for the label to display on the axis.
For other JavaScript updates included in Volume 1, be sure to look at our What’s New section.
