We use cookies to give you the best experience on our website. If you continue to browse, then you agree to our privacy policy and cookie policy.


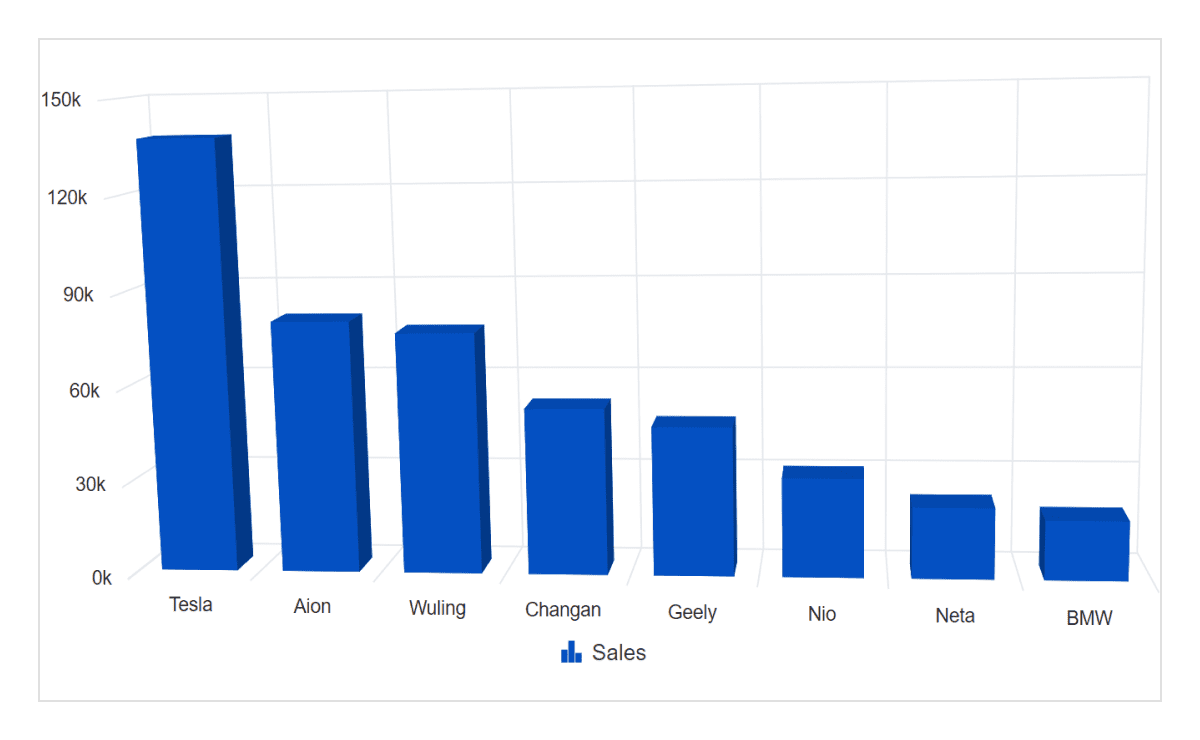
React 3D Charts is a graphical representation of data in three dimensions, showcasing relationships and trends among variables. Unlike traditional 2D charts, 3D charts add depth to the visualization, allowing for a more immersive and comprehensive understanding of data patterns.


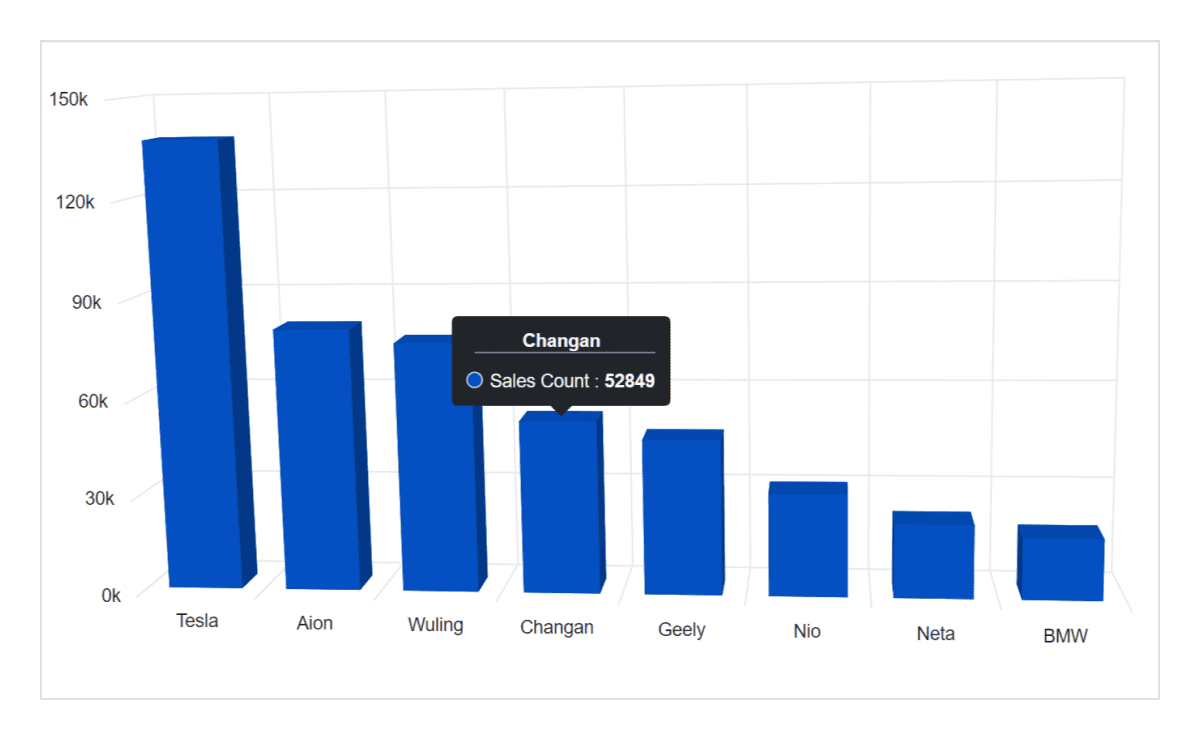
The tooltip cursor allows users to interact with the chart and obtain detailed information about data points.

The React 3D Chart supports legends, axis types, data labels, rotation, tilt, selection, and highlights.

The 3D charts have a highly responsive layout and an optimized design for desktops, touchscreens, and phones. It works well on all mobile phones that use iOS, Android, or Windows OS.

Cutting-edge design with several built-in themes, such as Material 3, Fluent, Tailwind CSS, Bootstrap, Material, and Fabric.

Users from different locales can use the control to format dates, currency, and numbering to suit their preferences.

The 3D Chart for React provides fluid animation to present data with smooth transitions.
Easily get started with the React 3D Chart using a few simple lines of TSX code as demonstrated below. Also, explore our React 3D Chart Example that shows you how to render and configure 3D Charts in React.
import * as React from "react";
import * as ReactDOM from "react-dom";
import { Category3D, Chart3DComponent, Column3DSeries, Inject, Chart3DSeriesCollectionDirective, Chart3DSeriesDirective} from'@syncfusion/ej2-react-charts';
import { SampleBase } from '../common/sample-base';
export class Default extends SampleBase<{}, {}> {
  public data: any = [{ x: 'Tesla', y: 13 },{ x: 'Aion', y: 8 }, { x: 'Wuling', y: 17 }, { x: 'Changan', y: 25 }, { x: 'Geely', y: 17 }, { x: 'Nio', y: 15 }, { x: 'Neta', y: 22 }, { x: 'BMW', y: 18 } ];
public primaryXAxis: any = {
   valueType: 'Category'
};
  render() {
    return (
        <div>
            <Chart3DComponent id='stockchart' primaryXAxis={this.primaryXAxis}
            height='350'>
            <Inject services={[Category3D, Column3DSeries]}/>
            <Chart3DSeriesCollectionDirective>
                <StockChartSeriesDirective dataSource={this.data} type='Column'>
                </StockChartSeriesDirective>
            </Chart3DSeriesCollectionDirective>
        </Chart3DComponent>
        </div>
    )
  }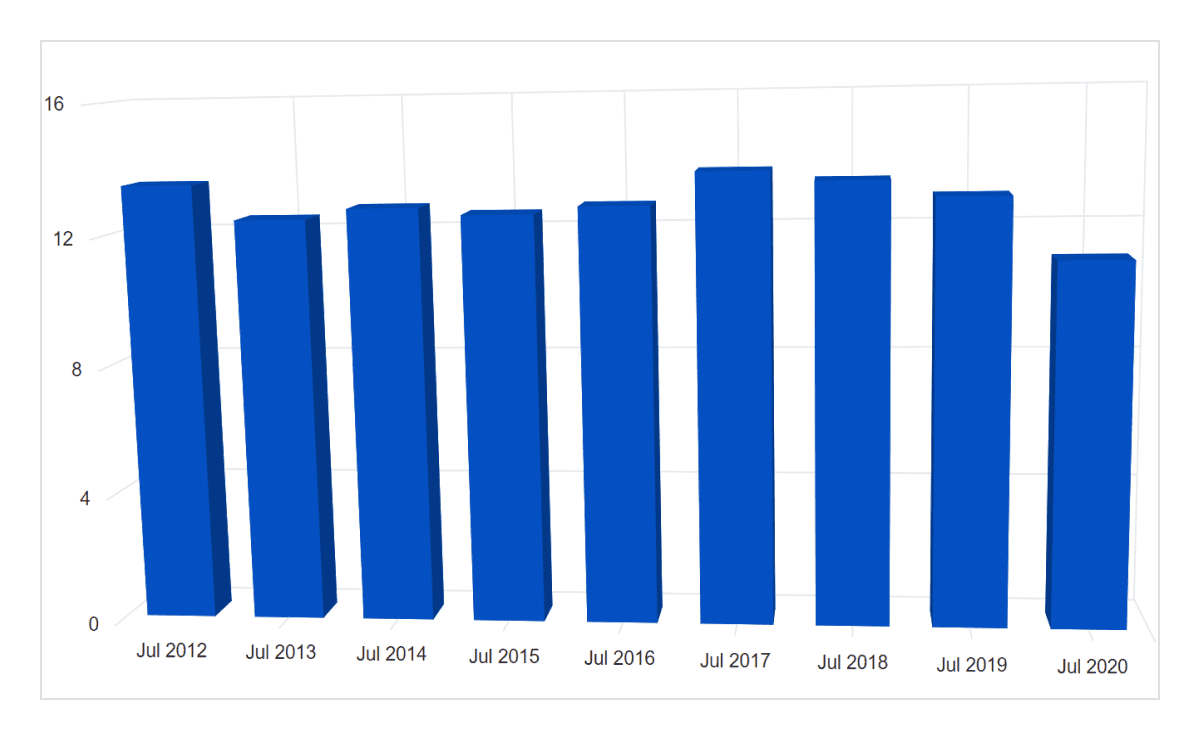
}The 3D charts can plot over six chart types, including column, bar, stacking column, stacking bar, 100% stacked column, and 100% stacked bar.

The 3D charts support legends to provide additional information about a series with customization options.
The 3D chart control provides options to display tooltips with details about pointer values on mouse hover.
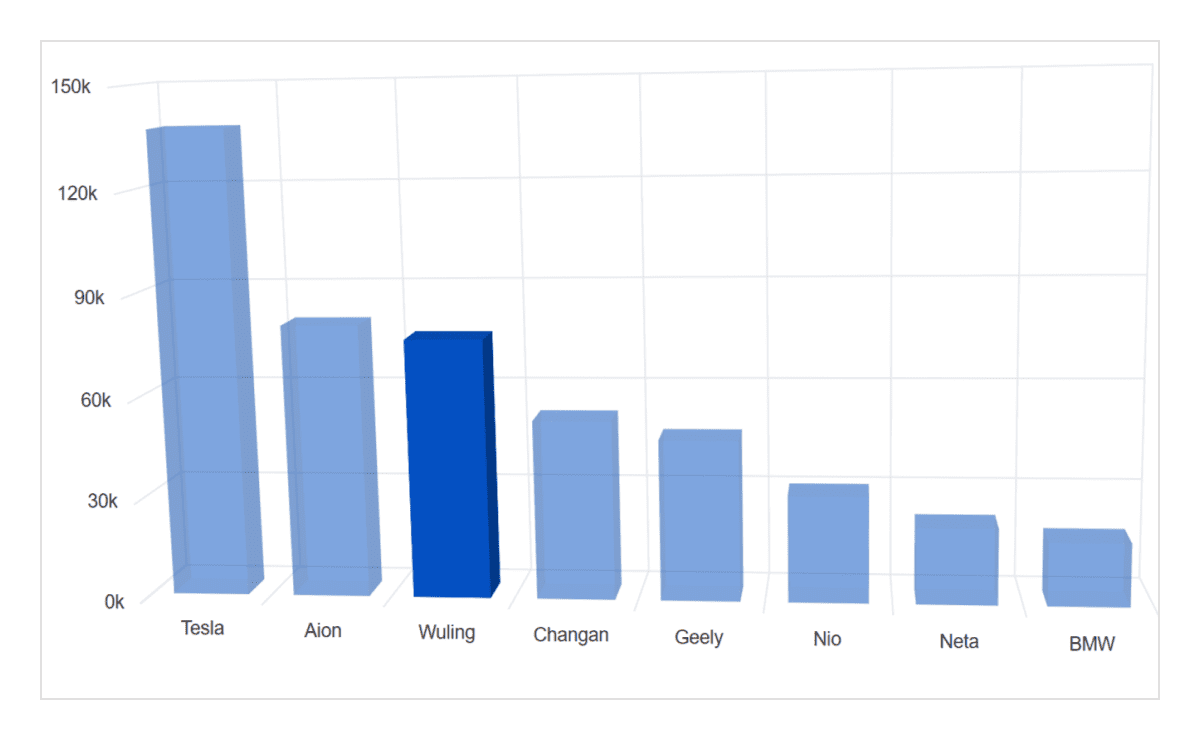
Select or highlight data points in a series for easy understanding of the selected data. Adding pattern and color to the selected data makes charts more interactive.
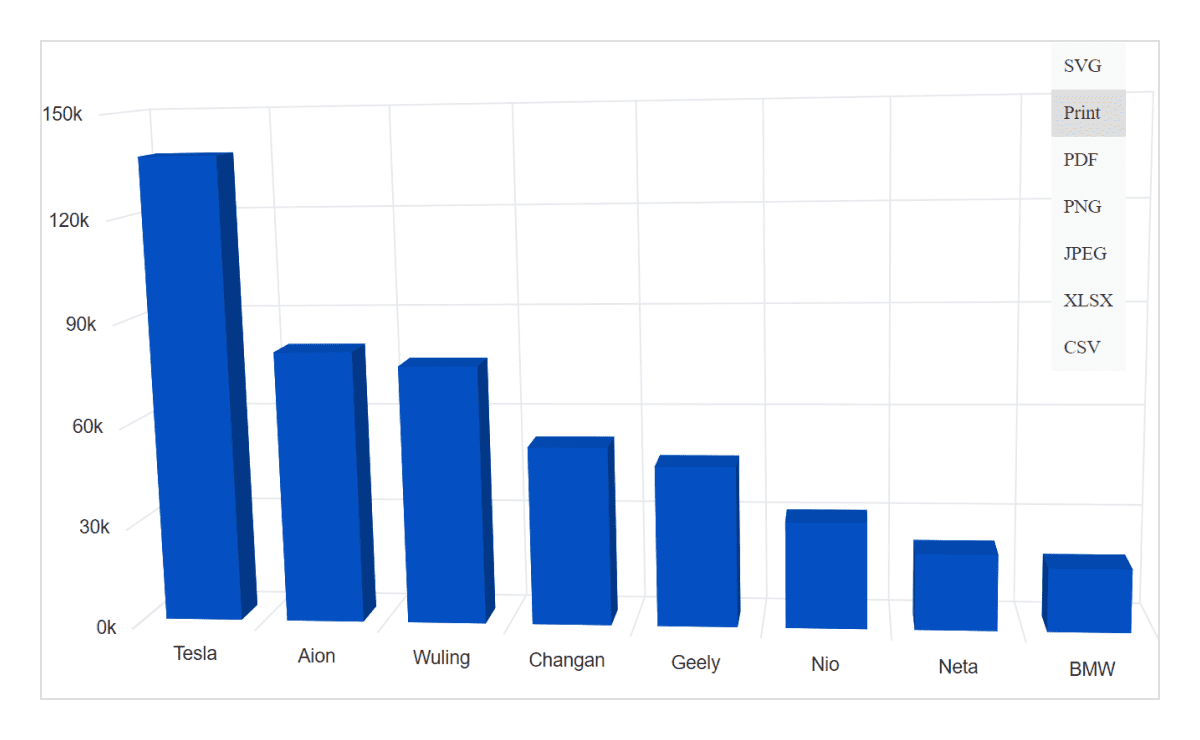
Export React 3D Charts to PDF documents or to image formats such as PNG and JPEG on the client side. Print the rendered 3D charts and graphs directly from the browser.
The 3D charts can plot different data types such as numbers, datetime, logarithmic, and string. The chart’s axis elements can be customized further to make an axis more readable.
The 3D charts support data labels to annotate points to improve the readability of data.
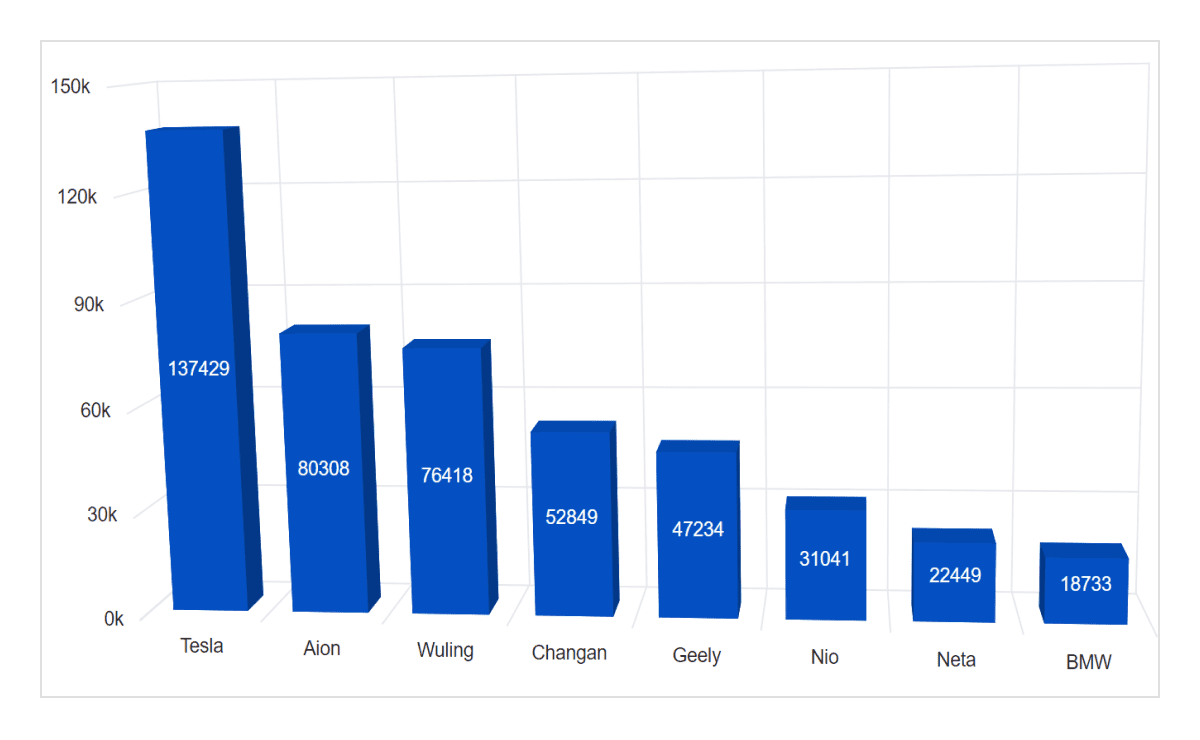

Customize the color of data points, the depth of the wall, and the wall color of the 3D charts using built-in APIs.
Plot multiple series in a single chart to compare different data values. Enabling legends and tooltips gives more information about an individual series.

The end-user experience is greatly enhanced by including a set of interactive features such as rotation, tilt, selection, and highlight.

Every element in the React 3D Chart is keyboard accessible. Major features like tooltips, legends, selection, and highlights can be used with keyboard commands alone. No mouse interaction is required. This helps in creating highly accessible applications.

React 3D Charts view has complete WAI-ARIA accessibility support. The 3D chart’s UI includes high-contrast visual elements that help visually impaired people to have the best viewing experience. Also, valid UI descriptions are easily accessible through assistive technologies such as screen readers.

Right-to-left rendering allows displaying the text and layout of 3D charts from right to left. This improves the user experience and accessibility for RTL languages.
The React 3D Charts with a rich set of features offers the following:
You can find our React 3D Charts demo, which demonstrates how to render and configure 3D Charts.
No, this is a commercial product and requires a paid license. However, a free community license is also available for companies and individuals whose organizations have less than $1 million USD in annual gross revenue, 5 or fewer developers, and 10 or fewer total employees.
A good place to start would be our comprehensive getting started documentation.


 Documentation
Greatness—it’s one thing to say you have it, but it means more when others recognize it. Syncfusion is proud to hold the following industry awards.


