Syncfusion Grid With Real Time Examples

The Syncfusion React Data Grid (data table) is a feature-rich control for displaying data in a tabular format. The wide range of functionalities includes data binding, editing, Excel-like filtering, custom sorting, support to export data grids to Excel, CSV, and PDF formats, aggregating rows, selection, etc. It provides extensive appearance customization options and is very useful for generating complex grid-based reports with rich formatting.
Why Choose Syncfusion React Grid?
Are you looking for a robust and powerful data grid to quench your UI requirements? If so, I will give you good reasons to choose Syncfusion React Grid and show you why it is the best data grid around.
- High Performance: Load millions of records in seconds with optimized performance.
- Seamless Data Binding: Easily bind to various local and remote data sources like JSON, OData, WCF, and RESTful web services.
- Adapts to any resolution: Adapts to any resolution, working seamlessly on desktops, touch screens, and mobile devices (iOS, Android, Windows).
- Flexible Editing: Simplify CRUD operations with support for business objects or remote data services.
- Custom Templates: Create custom user experiences with a wide range of template options.
- Customizable Themes: Choose from 5+ built-in themes (Fluent, Tailwind CSS, Bootstrap, Material, Fabric) and customize them with the Theme Studio tool.
- Easy Export and Printing: Export data to Excel, PDF, and CSV, and print all rows or just the current page.
- Globalization and Localization: Format dates, currency, and numbers for different locales.
- State-of-the-art features: Enjoy features like lazy load grouping, freeze columns, powerful filtering, bulk editing, responsive columns, and state management.
- Web Accessibility: Fully supports web accessibility, making it usable for people with disabilities.
- Ease of Use: Minimal configuration required, with intuitive API names that simplify usage.
Our Target Audience
The Syncfusion React Grid component simplifies the analysis of your business data and helps manage daily data transitions. It also enables you to examine user data or product information or any values within specific time frames, whether daily or otherwise. Additionally, it supports real-time applications with autofill capabilities and allows exporting information for hard copy documentation. Here are examples of users and organizations that benefit from using a Syncfusion React Grid component.Top Features in Syncfusion DataGrid
Top features
Reference
Realtime samples using Syncfusion React DataGrid
Inventory and Billing Insights
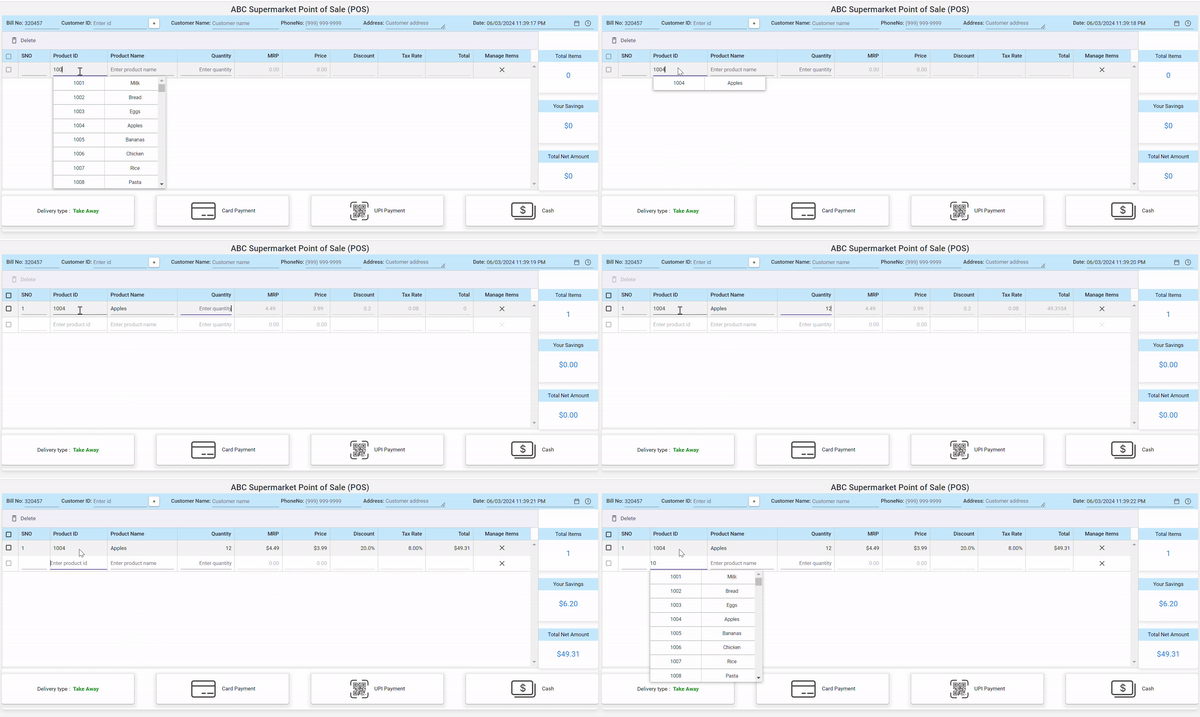
In the competitive world of retail, particularly in supermarkets, efficient billing, and invoicing are essential for enhancing customer satisfaction and streamlining operations. This article explores how Syncfusion React Grid can transform supermarket billing and invoicing processes, making them more efficient and user-friendly. This demo will show you how to utilize the Syncfusion Data Grid to generate an invoice with automatic calculations based on your inventory details. With our step-by-step guide, you'll be able to easily set up and configure the data grid to meet your specific needs.
Hotel booking application using Syncfusion React DataGrid
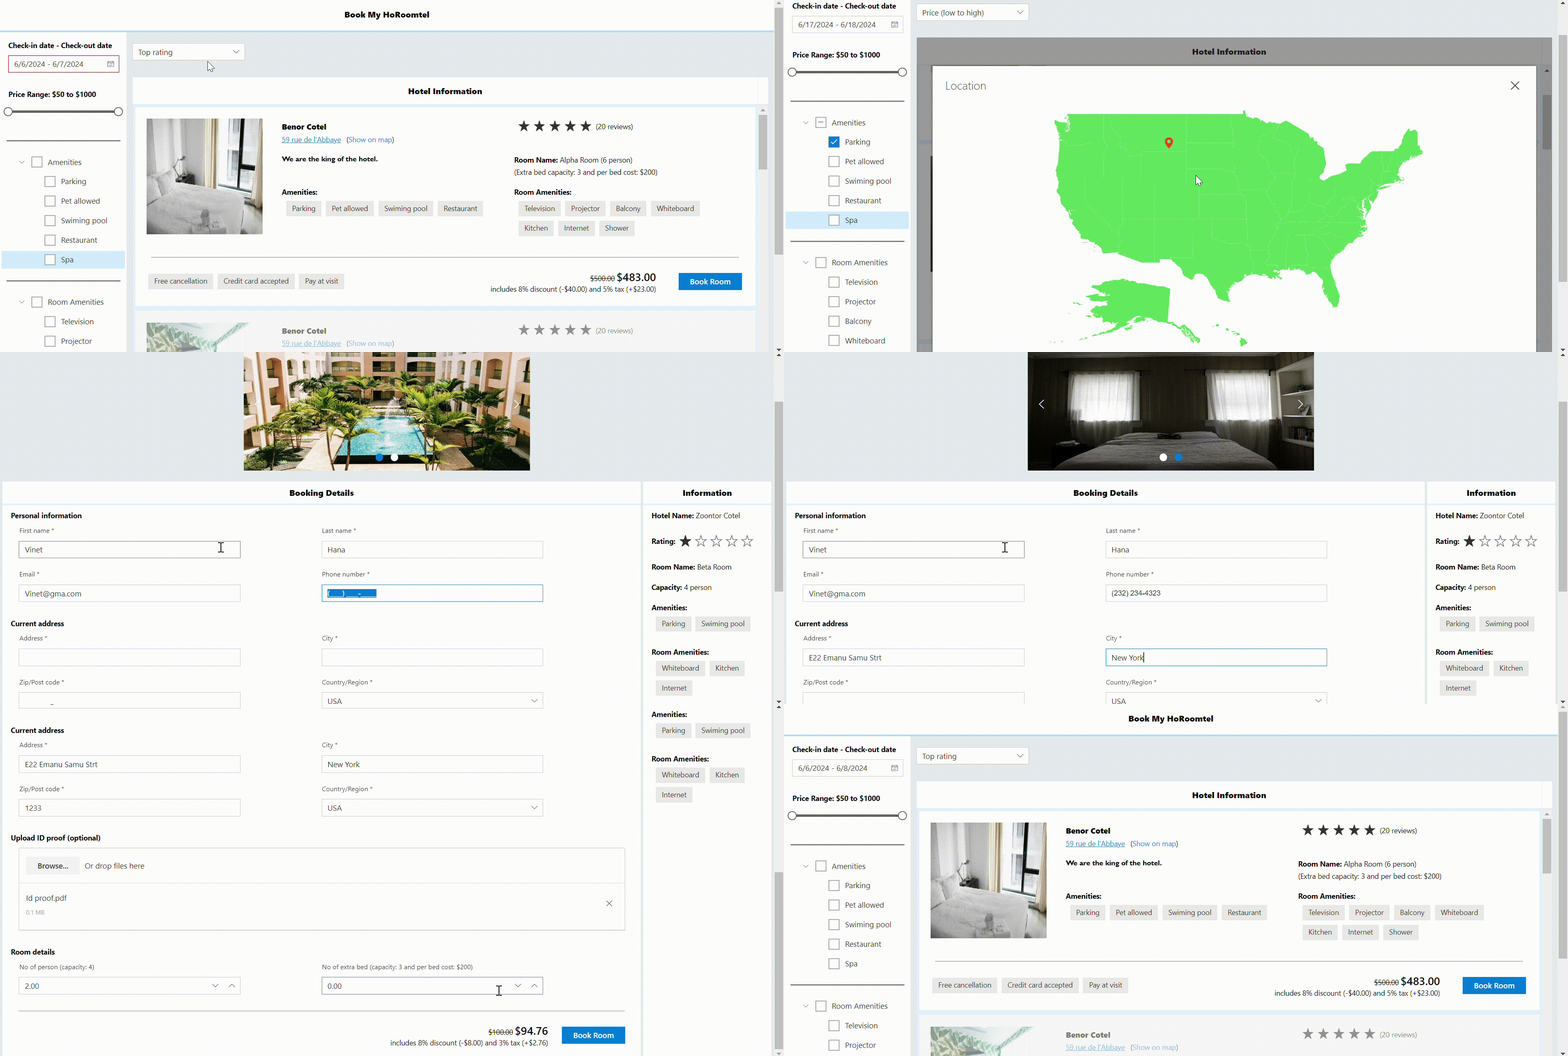
While looking for a secure and comfortable hotel stay that fits your budget, preferred amenities, desired location, and high user reviews, this article explores how Syncfusion React Grid can display a comprehensive list of hotels and their rooms, along with facilities, user reviews, and costs. Additionally, Syncfusion React Grid offers filtering options based on budget, amenities, location, and user reviews, making the booking process more efficient and user-friendly.
This demo will show you how to utilize the Syncfusion Data Grid to display the lists of hotels and it facility and cost and locations and user reviews. Also, how to provide the option to select the hostel based on available hotel rooms on the selected check and checkout date with budget-wise and facilities and user review. With our step-by-step guide, you'll be able to easily set up and configure the data grid to meet your specific needs.
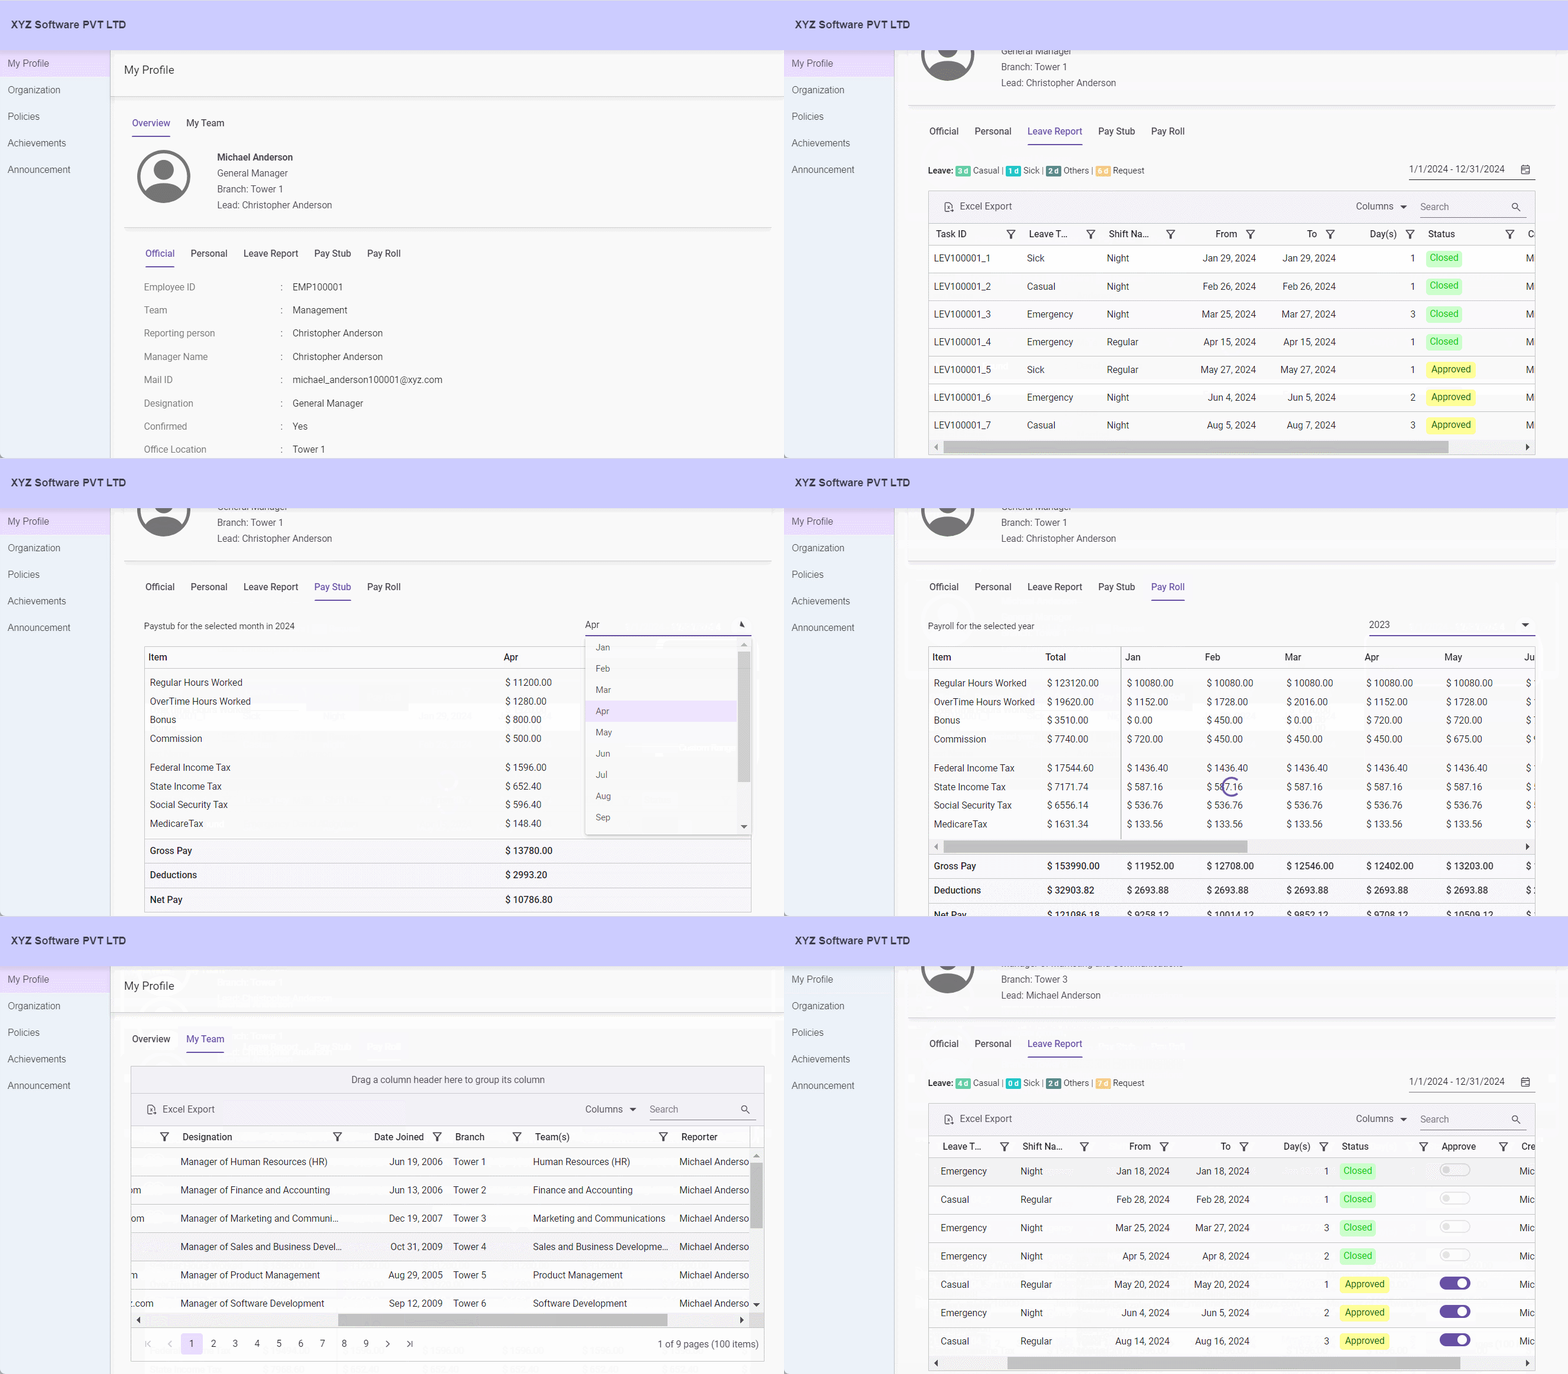
Employee management application using Syncfusion React DataGrid
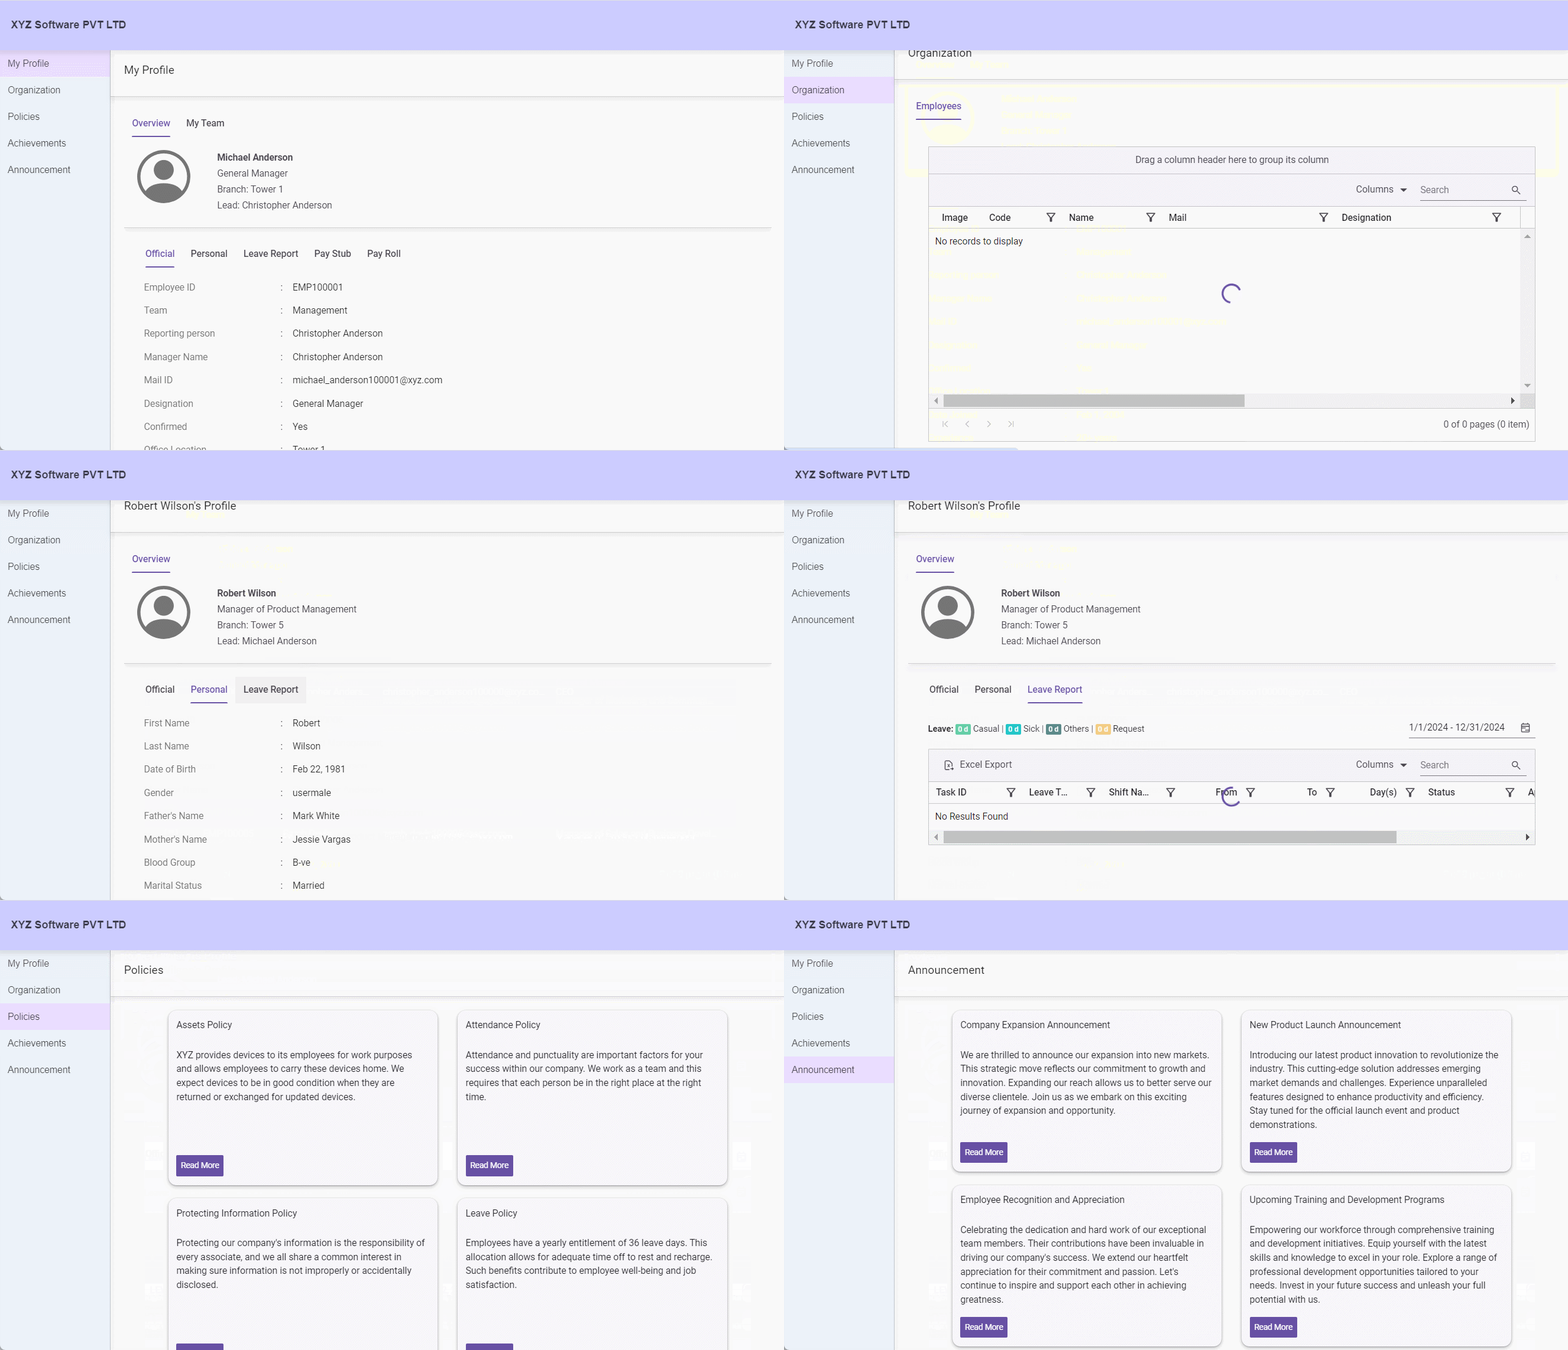
The Syncfusion React DataGrid is a robust and versatile data visualization component designed to efficiently manage large datasets. It offers a comprehensive range of features, including sorting, filtering, grouping, and pagination, as well as data exporting and printing, all of which are essential for developing an effective and user-friendly statistics reporting tool. In this guide, we will demonstrate how to create an Employee Portal management application using the Syncfusion Data Grid.
Building a FIFA stats report application with Syncfusion React DataGrid
The Syncfusion React DataGrid is a powerful and versatile data visualization component, adept at efficiently managing large datasets. It provides an extensive range of features, including sorting, filtering, grouping, and pagination, which are crucial for developing an effective and user-friendly statistics reporting tool. In this application, the Syncfusion DataGrid is used to display comprehensive FIFA World Cup records and statistics, covering the entire history of the tournament from 1930 to 2022. The FIFA World Cup statistics and data utilized in this application are sourced from Wikipedia. We extend our sincere thanks to Wikipedia for their invaluable resource, which has been instrumental in preparing this demonstration.
Stock Market application with Syncfusion React DataGrid
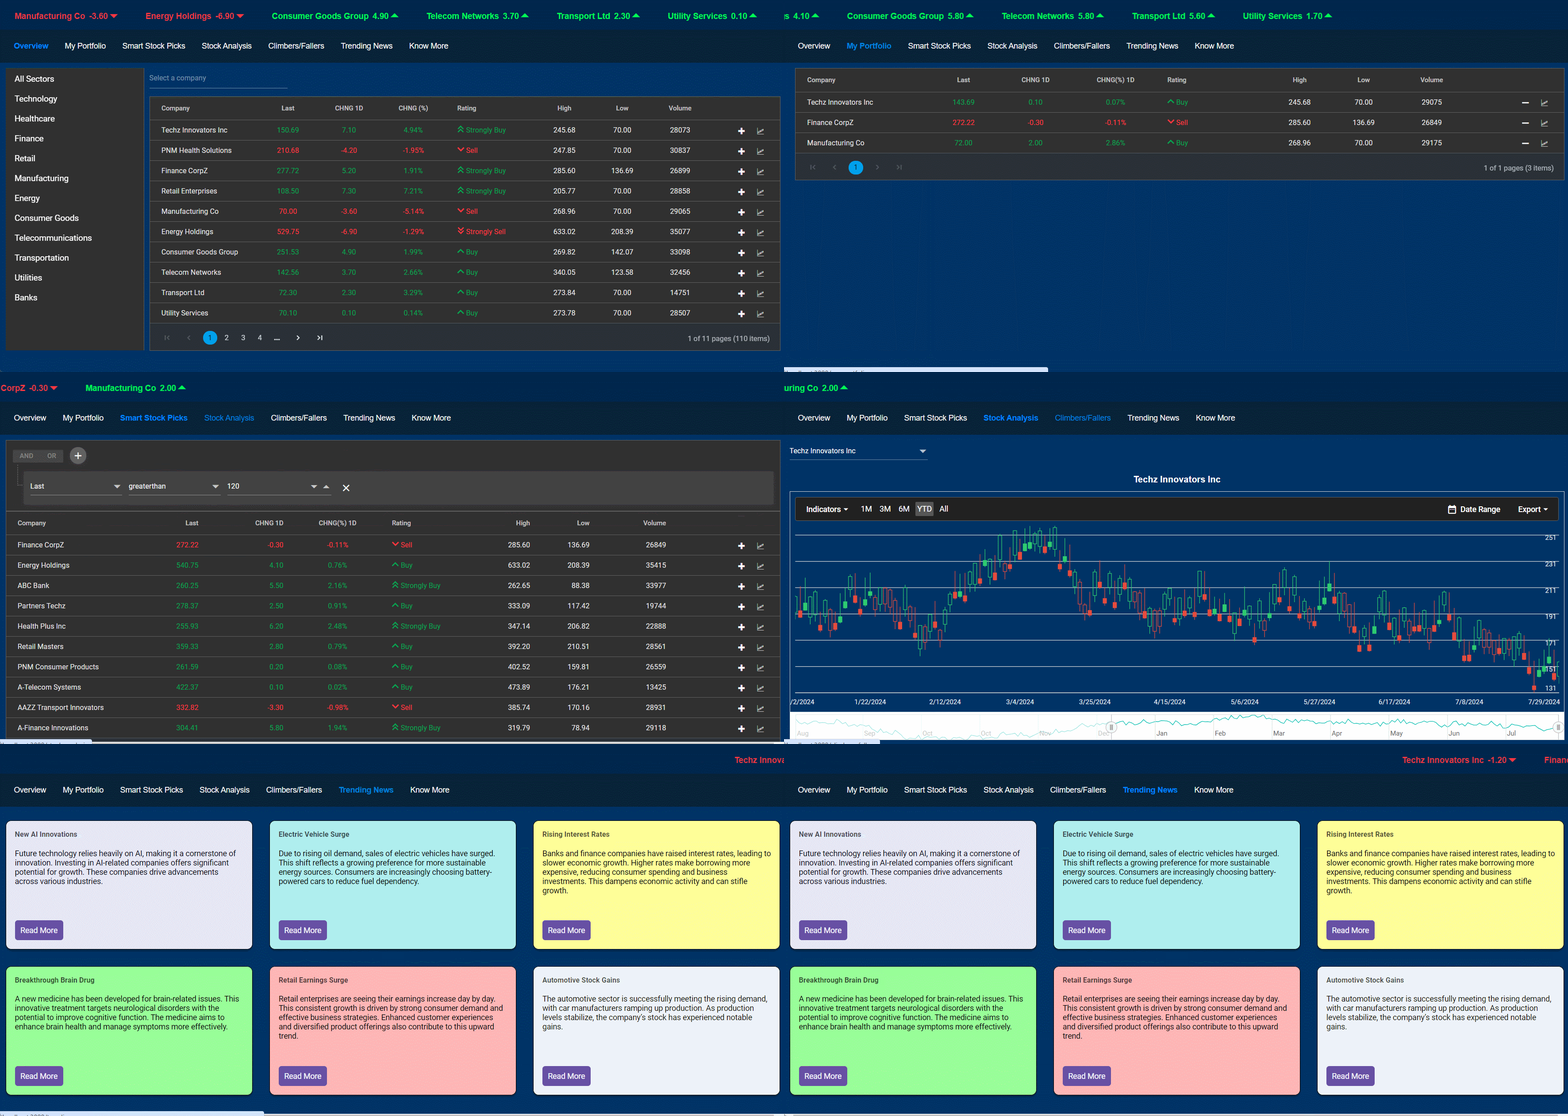
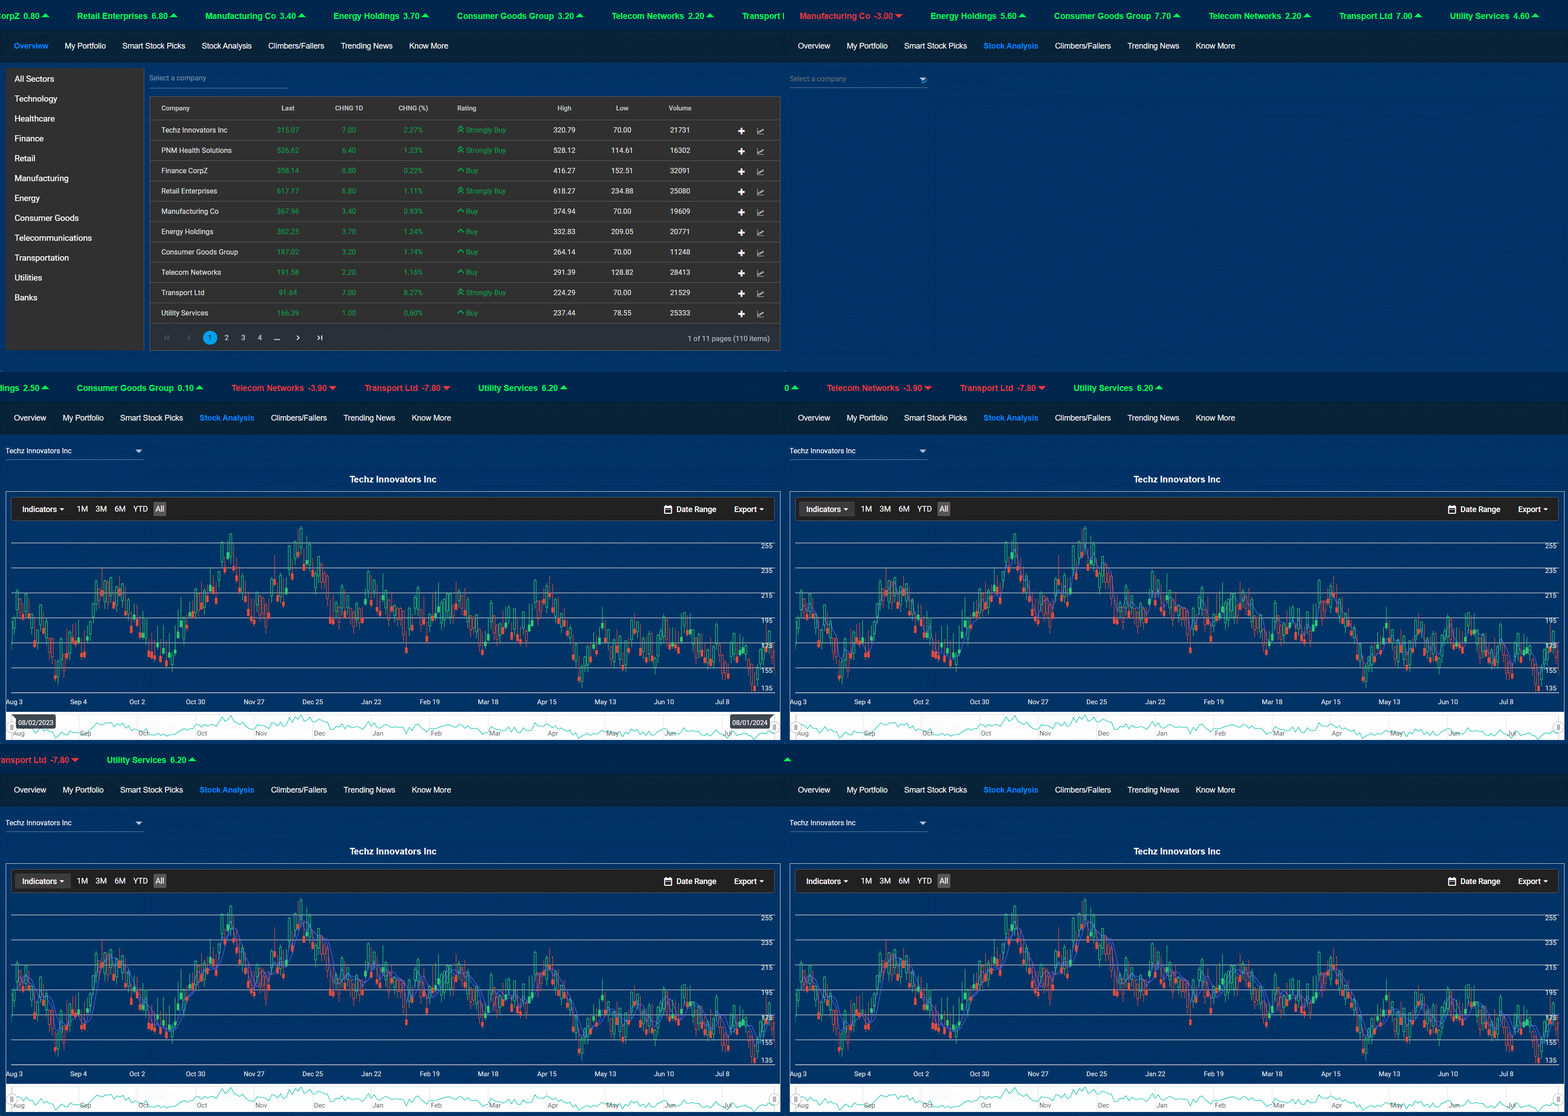
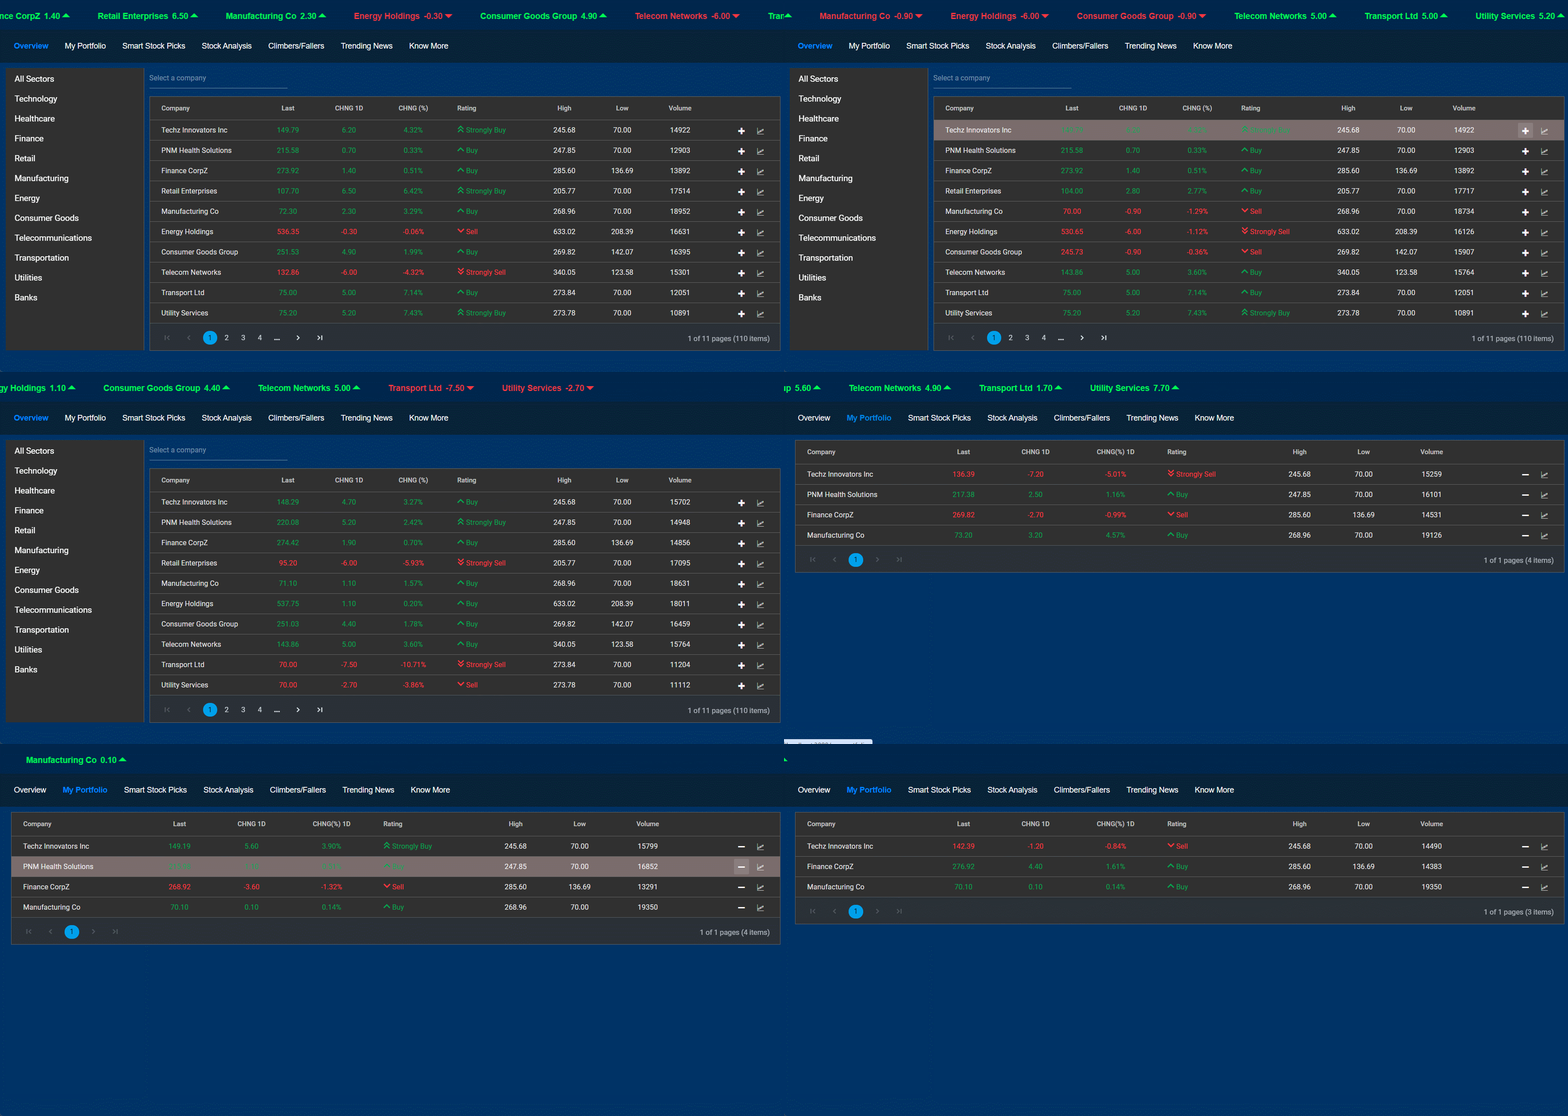
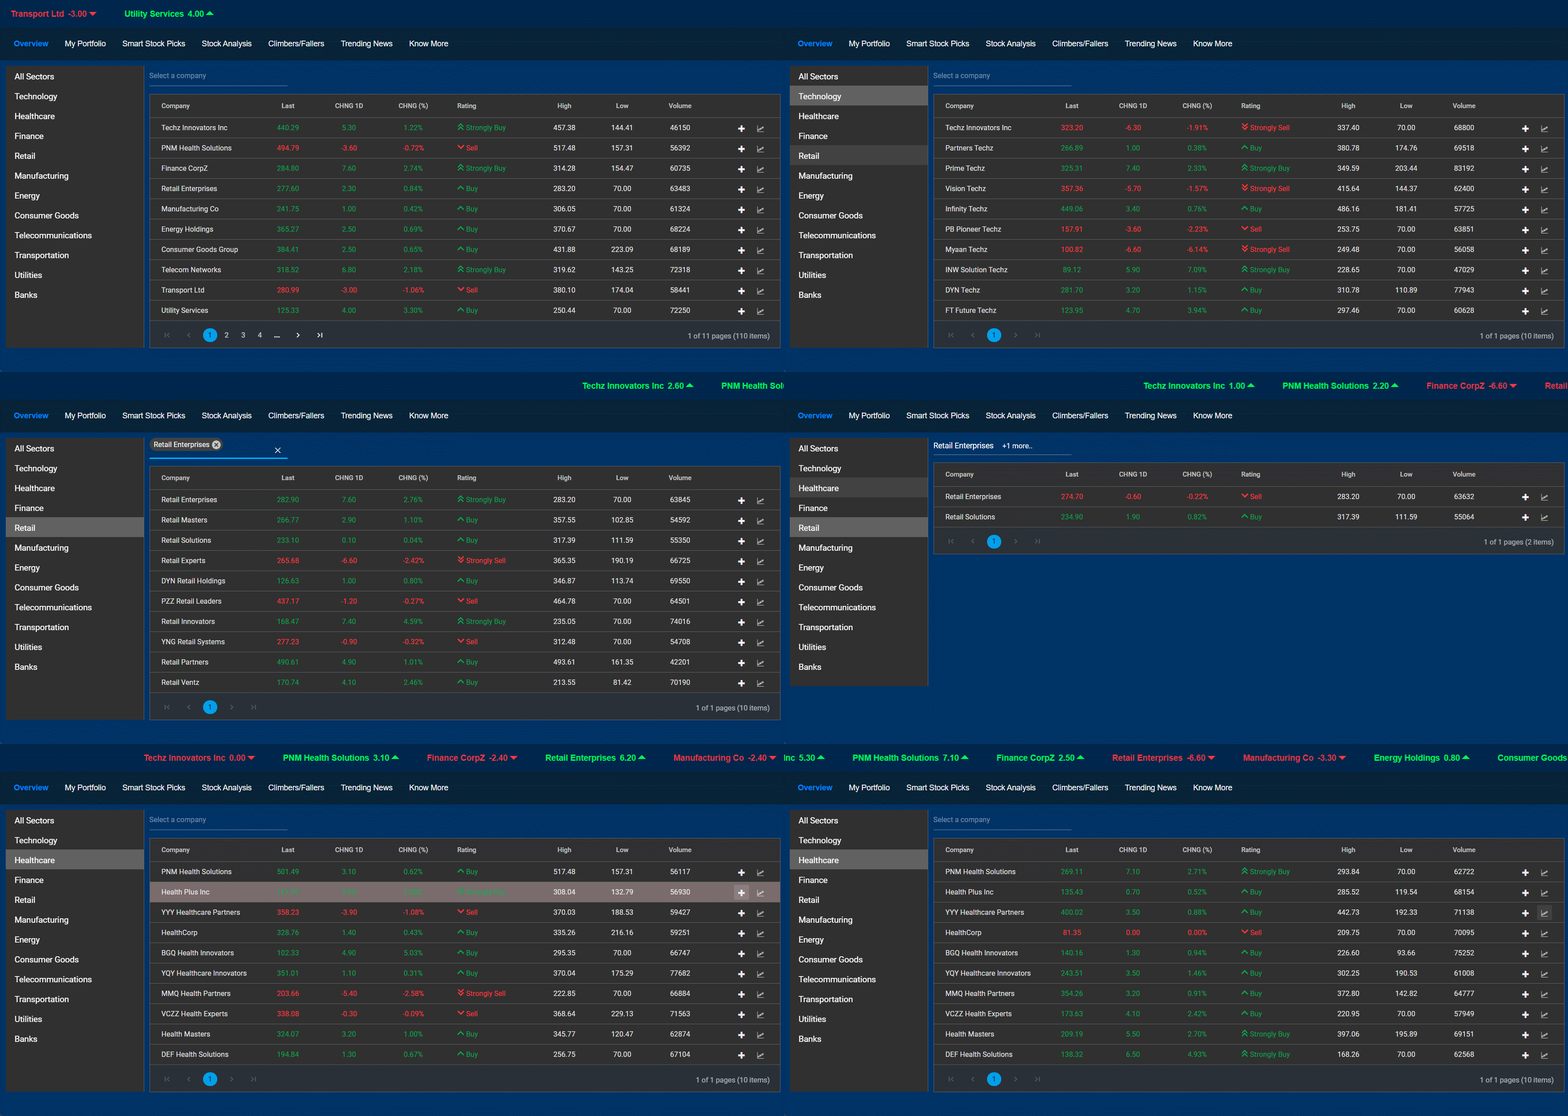
The Syncfusion DataGrid is a powerful tool for manipulating data, offering features such as sorting, filtering, searching, CRUD operations, grouping, exporting, and printing options. It can update cells every second without any performance lag. In this example, we created a stock market application using the Syncfusion DataGrid to perform technical analysis with the Chart component.
In this demo, you can add stocks to your wishlist portfolio and filter stocks by business category. You can analyze stock performance using the Chart component for intraday trends. The application allows analysis with a candlestick chart across different time frames: 1M, 3M, 6M, YTD, and All. Additionally, you can apply technical analysis using popular formulas, including:
- EMA Indicator
- RSI Indicator
- Bollinger Bands
- TMA Indicator
- Momentum Indicator
- SMA Indicator
- ATR Indicator
- Accumulation Distribution Indicator
- MACD Indicator
- Stochastic Indicator
- Moreover, you have the option to select stocks using query filtering. The demonstration also displays charts of the top gainers and losers.
