How To Use The Drill Down Functionality In UWP Charts

The drill-down is a capability that takes the user from a more general view of the data to a more specific one at the click of a mouse. It also gives the user the ability to see data and information in more detail with different styles.
Syncfusion SfChart in UWP platform has achieved this drill down functionality with help of its SelectionChangedEvent and its way populating the data to the chart with considering the below use case.
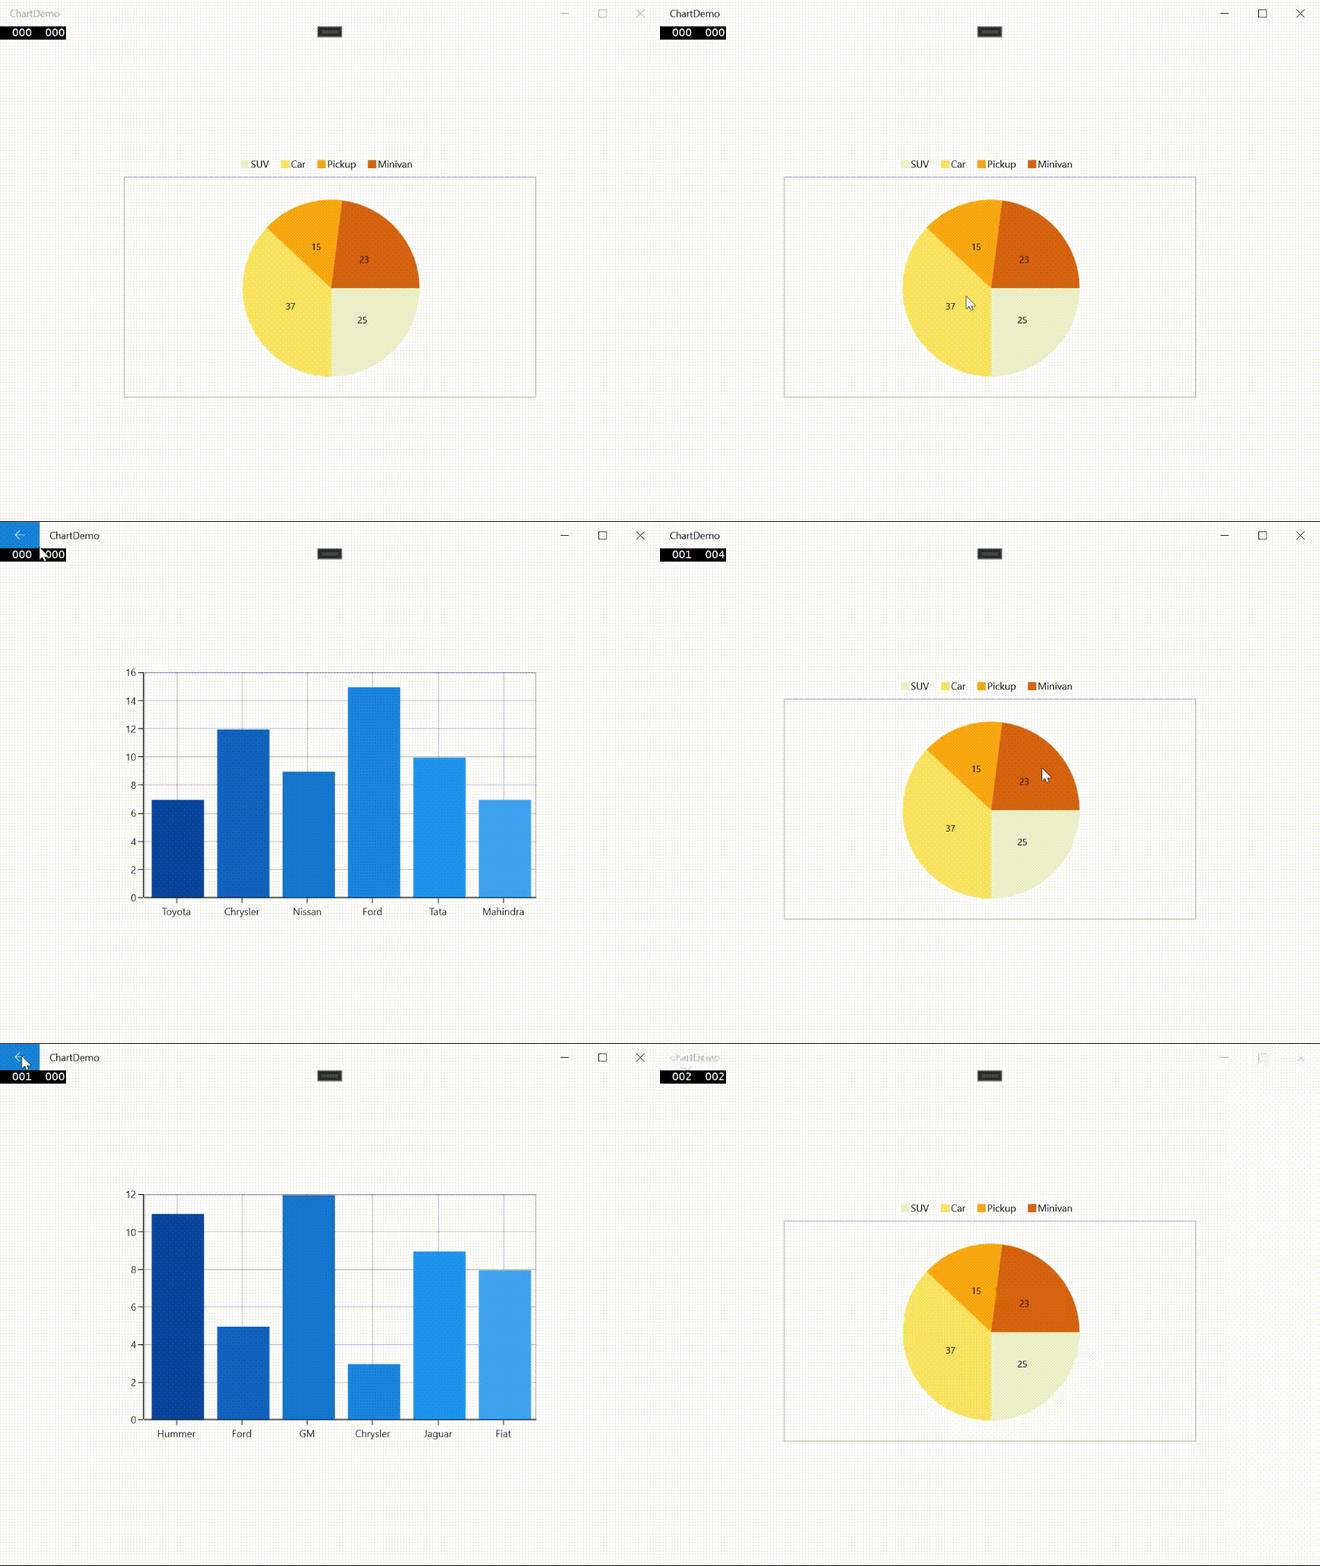
In automobile sales concept, initial chart representation is about the list of automobiles (Pie chart representation) and each segment tap, leads to have a variety of its brands list (Column chart representation).
The following steps will guide you how to achieve this expected functionality,
Step 1: Define the chart with list of automobiles collection.
<syncfusion:SfChart SelectionChanged="chart_SelectionChanged" Height="300" Width="500">
            <!--Definition of legend-->
            <syncfusion:SfChart.Legend>
                <syncfusion:ChartLegend/>
            </syncfusion:SfChart.Legend>

            <!--To enable the selection support-->
            <syncfusion:SfChart.Behaviors>
                <syncfusion:ChartSelectionBehavior EnableSegmentSelection="True" />
            </syncfusion:SfChart.Behaviors>

            <!--Series declaration-->
            <syncfusion:PieSeries ItemsSource="{Binding Data}" Palette="AutumnBrights" XBindingPath="Type" YBindingPath="Value" >
                <syncfusion:PieSeries.AdornmentsInfo>
                    <syncfusion:ChartAdornmentInfo  ShowLabel="True" />
                </syncfusion:PieSeries.AdornmentsInfo>
            </syncfusion:PieSeries>
        </syncfusion:SfChart>
Here Data represents the collection of models which has name of automobile variety and its count values.
Step 2: Drill-down functionality observed concepts.
private void chart_SelectionChanged(object sender, ChartSelectionChangedEventArgs e)
        {
            IList items = e.SelectedSeries.ItemsSource as IList;
            if (e.SelectedIndex != -1)
            {
                //Set the current window content from navigated page which is representing the chart with detailed
                Window.Current.Content = new SecondPage(items[e.SelectedIndex] as Model);

                //To get back to initial page, enable the back button with the help of SystemNavigationManager's AppViewBackButtonVisibility.
                SystemNavigationManager.GetForCurrentView().AppViewBackButtonVisibility = AppViewBackButtonVisibility.Visible;

                //Once back button click to view the entire automobile list then, it will keep the content of window as main page
                SystemNavigationManager.GetForCurrentView().BackRequested += (s, r) =>
                {
                    Window.Current.Content = new MainPage();
                    SystemNavigationManager.GetForCurrentView().AppViewBackButtonVisibility = AppViewBackButtonVisibility.Collapsed;
                };
            }
        }
Step 3: Declaration of navigated page and its data populated ways.
<syncfusion:SfChart  Height="300" Width="500">
            <syncfusion:SfChart.PrimaryAxis>
                <syncfusion:CategoryAxis>
                </syncfusion:CategoryAxis>
            </syncfusion:SfChart.PrimaryAxis>
            <syncfusion:SfChart.SecondaryAxis>
                <syncfusion:NumericalAxis/>
            </syncfusion:SfChart.SecondaryAxis>
            <!--desired series declaration with populating the specific collection-->
            <syncfusion:SfChart.Series>
                <syncfusion:ColumnSeries XBindingPath="Type" YBindingPath="Value" ItemsSource="{x:Bind SelectedModel.Collections}" Palette="BlueChrome">
                    <syncfusion:ColumnSeries.AdornmentsInfo>
                       <syncfusion:ChartAdornmentInfo/>
                    </syncfusion:ColumnSeries.AdornmentsInfo>
                </syncfusion:ColumnSeries>
            </syncfusion:SfChart.Series>
        </syncfusion:SfChart>
public sealed partial class SecondPage : Page
    {
        //SelectedModel represents the collection of automobile variety list
        public Model SelectedModel { get; set; }

        public SecondPage(Model selectedDatapoint)
        {
            InitializeComponent();

            SelectedModel = selectedDatapoint;
        }
    }
Output

See also
How to add multiple legend items in scroll viewer in UWP Chart
How to get a notification when the legend items are clicked in UWP Chart


