
TL;DR: Syncfusion Blazor Pivot Table is the perfect tool for data analysis. To further boost its performance, we’ve shared some best practices, including using individual NuGet packages, deferred layout updates, virtual scrolling, server-side engines and more. You can also optimize Blazor apps by preventing unnecessary re-rendering. Read the blog for more details.
Importance of performance in Pivot Tables
Performance is paramount in pivot tables, especially when handling extensive datasets. Think of a pivot table as your data superhero—it manages vast amounts of information and distills it into actionable insights for informed decision-making.
This blog will explore the best practices for speeding up your data analysis with the Syncfusion Blazor Pivot Table. Discover essential techniques that ensure peak performance when working with large datasets. Let’s empower your data superhero to manage your data swiftly!
Enhancing loading performance with individual NuGet packages, scripts, and CSS
To boost the performance of the Syncfusion Blazor Pivot Table during initial rendering and UI interactions, it’s recommended to reference individual NuGet packages (Syncfusion.Blazor.PivotTable) along with specific script and CSS files.
Consolidated packages (Syncfusion.Blazor) include definitions for all components, resulting in larger package sizes. Combined with script and CSS files, this increases file size as they encompass resources for all Syncfusion Blazor components.
Larger package, script, and CSS file sizes may lead to delays or performance issues compared to Pivot Tables rendered with individual packages, scripts, and CSS. Individual NuGet packages encompass all necessary dependent component sources and script references, eliminating the need for external references and individual package usage.
For more details, refer to the documentation for Individual NuGet packages and adding script and CSS.
Optimizing user experience with deferred layout updates
The Deferred Layout Update feature proves invaluable for enhancing the functionality of the Blazor Pivot Table. It enables users to update the component only when necessary, particularly after performing operations in the Field List, such as rearranging fields, filtering, sorting, and changing aggregation type.
This process is efficient because when users complete their modifications and apply them by clicking the Apply button in the Field List, the Blazor Pivot Table will be updated based on the last modified report. The Pivot Table remains unchanged by deferring the layout update until requested, minimizing resource usage, and avoiding frequent re-rendering.
For more insights on deferred layout updates, consult the documentation.
Refer to the following GIF image.
Virtual scrolling
Virtual scrolling in Blazor Pivot Table significantly boosts performance, particularly with large datasets, by selectively rendering only the visible rows and columns in the current view. Additional data will dynamically load as users scroll vertically or horizontally.
To activate this feature, set the EnableVirtualization property to true within the SfPivotView class. This straightforward step guarantees a seamless and efficient experience when handling extensive data.
Refer to the following GIF image.
Note: Also, check out the Example of virtual scrolling in the Blazor Pivot Table.
Best practices to use virtual scrolling in Blazor Pivot Table
Here are some best practices for utilizing virtual scrolling in the Blazor Pivot Table component:
1. Single page mode
By default, the Pivot Table with virtual scrolling renders the current view page along with the previous and next pages.
This approach, known as single-page mode, optimizes performance by rendering only the rows and columns relevant to the current view. Implementing this feature significantly enhances the Blazor Pivot Table’s performance.
Refer to the following code example.
@using Syncfusion.Blazor.PivotView
<SfPivotView TValue="PivotVirtualData" EnableVirtualization="true" EnableValueSorting=true ShowTooltip=false Width="800" Height="500">
    <PivotViewVirtualScrollSettings AllowSinglePage="true"></PivotViewVirtualScrollSettings>
    <PivotViewDataSourceSettings DataSource="@data" EnableSorting="false" AlwaysShowValueHeader="true">
        <PivotViewColumns>
            <PivotViewColumn Name="Year" ExpandAll="true"></PivotViewColumn>
            <PivotViewColumn Name="City"></PivotViewColumn>
        </PivotViewColumns>
        <PivotViewRows>
            <PivotViewRow Name="ProductID"></PivotViewRow>
        </PivotViewRows>
        <PivotViewValues>
            <PivotViewValue Name="Price" Caption="Unit Price"></PivotViewValue>
            <PivotViewValue Name="Sold" Caption="Unit Sold"></PivotViewValue>
        </PivotViewValues>
        <PivotViewFormatSettings>
            <PivotViewFormatSetting Name="Price" Format="C0"></PivotViewFormatSetting>
        </PivotViewFormatSettings>
    </PivotViewDataSourceSettings>
    <PivotViewGridSettings ColumnWidth="120"></PivotViewGridSettings>
</SfPivotView>
@code{
    private List<PivotVirtualData> data { get; set; }
    protected override void OnInitialized()
    {
        this.data = PivotVirtualData.GetVirtualData().ToList();
        //Bind the data source collection here. Refer to the "Assigning sample data to the pivot table" section in the Getting Started document for more details.
    }
    public class PivotVirtualData
    {
        public string ProductID { get; set; }
        public string Year { get; set; }
        public string Country { get; set; }
        public string Quarter { get; set; }
        public double Price { get; set; }
        public DateTime Date { get; set; }
        public double Sold { get; set; }
    }
Refer to the following output GIF image.
Also, explore a sample showcasing the performance of the Blazor Pivot Table with virtual scrolling enabled, specifically using the single-page mode, across various data ranges.
Let’s compare the performance metrics for rendering 100,000 records with virtualization, both with and without the single-page mode enabled, in the Pivot Table using Blazor WebApp with Interactive Auto mode.
|
Action |
Without single-page mode |
With single-page mode |
|
Initial rendering |
6.37 sec |
3.76 sec |
|
Scrolling |
4.32 sec |
0.87 sec |
2. Limiting the component size
Each row and cell in the Blazor Pivot Table is treated as an individual Razor component. However, loading many rows and columns into the current view can strain memory consumption and CPU processing.
Load smaller rows and columns to avoid such performance impacts by defining and limiting the Pivot Table using the Height and Width properties. For example, 600px * 1000px, respectively, with just the Pivot Table alone (without the grouping bar, toolbar, and other additional UI’s).
Note: The pixel units are preferred, which ensures more accurate page calculations than percentage units, which involve additional computations for determining page row and column sizes.
3. Avoid incorporating column-related features
When dealing with large datasets, certain column-related features, such as resizing, autofit, text wrapping, and the dynamic hiding of specific columns, can significantly impact the Pivot Table’s row height and column width at runtime. So, it’s better to avoid them while virtual scrolling is enabled.
Paging
If your browser’s maximum pixel height restricts your use of the Pivot Table with virtual scrolling, we recommend utilizing the paging feature instead. Like virtual scrolling, paging allows you to load a large amount of data, which can be displayed on the Pivot Table page by page.
Optimizing the data handling during engine population: Best practices
Here’s a list of best practices concerning data handling via sorting, filtering, and grouping.
Sorting
When initially rendering, applying sorting to fields other than the string data type, which may have numerous members, can significantly delay the framing of the pivot engine (i.e., internal pivot calculation). It is advisable to avoid sorting to mitigate this performance issue without impacting the outcome. Instead, load the original data into the data source in the desired order for presentation in the Blazor Pivot Table.
Note: Once you’ve arranged the input data in the desired order and rendered the Blazor Pivot Table, you can minimize sorting usage for better run-time performance.
Member filtering
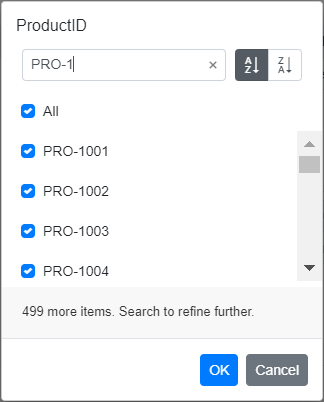
When managing large datasets, limiting the display of members in the filter dialog UI is beneficial. By setting a limit, the filter dialog UI can promptly show members up to that threshold without encountering performance issues. A message will indicate the count of the remaining members at the bottom of the filter dialog UI, helping us identify the members beyond the limit. To access these remaining members, utilize the search option in the filter dialog during runtime.
Note: For more details, refer to implementing node limits in the filter dialog UI documentation.
Refer to the following image.
Grouping
Utilizing the built-in grouping feature to group date, number, and string data type fields is generally not recommended due to its impact on overall performance during Pivot Table rendering.
Here’s an example demonstrating the usage of PivotViewGroupSettings class to configure grouping for available fields using code-behind. Expressly, date and number grouping have been set for TimeLine and Id fields, respectively.
This process consistently consumes the input data source, splits it, reframes it, and provides modified input data sources based on the fields in the report for further pivot calculations.
@using Syncfusion.Blazor.PivotView
<SfPivotView TValue="GroupData" Width="1000" Height="600">
     <PivotViewDataSourceSettings DataSource="@data">
        <PivotViewColumns>
            <PivotViewColumn Name="Id"></PivotViewColumn>
        </PivotViewColumns>
        <PivotViewRows>
            <PivotViewRow Name="TimeLine"></PivotViewRow>
        </PivotViewRows>
        <PivotViewValues>
            <PivotViewValue Name="PowUnits"></PivotViewValue>
            <PivotViewValue Name="ProCost"></PivotViewValue>
        </PivotViewValues>
        <PivotViewFormatSettings>
            <PivotViewFormatSetting Name="ProCost" Format="C"></PivotViewFormatSetting>
        </PivotViewFormatSettings>
        <PivotViewGroupSettings>
            <PivotViewGroupSetting Name="TimeLine" Type=GroupType.Date GroupInterval="new List<DateGroup> { DateGroup.Years, DateGroup.Months }"></PivotViewGroupSetting>
            <PivotViewGroupSetting Name="Id" Type=GroupType.Number RangeInterval=3></PivotViewGroupSetting>
        </PivotViewGroupSettings>
    </PivotViewDataSourceSettings>
</SfPivotView>
@code{
    private List<GroupData> data { get; set; }

    protected override void OnInitialized()
    {
        data = GroupData.GetGroupData();
        // Bind the data source collection here. Refer to the "Assigning sample data to the pivot table" section in the getting started document for more details.
    }
    public class GroupData
    {
        public int Id { get; set; }
        public DateTime TimeLine { get; set; }
        public string Sector { get; set; }
        public string EnerType { get; set; }
        public string EneSource { get; set; }
        public int PowUnits { get; set; }
        public int ProCost { get; set; }
        public static List<GroupData> GetGroupData()
        {
            List<GroupData> groupData = new List<GroupData>();
            groupData.Add(new GroupData
            {
                Id = 1001,
                TimeLine = new DateTime(2015,1,1),
                Sector = "Public Sector",
                EnerType = "Free Energy",
                EneSource = "Hydro-electric",
                PowUnits = 46,
                ProCost = 43
            });
            groupData.Add(new GroupData
            {
                Id = 1002,
                TimeLine = new DateTime(2015,1,2),
                Sector = "Private Sector",
                EnerType = "Free Energy",
                EneSource = "Geo-thermal",
                PowUnits = 30,
                ProCost = 29
            });
            groupData.Add(new GroupData
            {
                Id = 1003,
                TimeLine = new DateTime(2015,2,3),
                Sector = "Public Sector",
                EnerType = "Free Energy",
                EneSource = "Solar",
                PowUnits = 125,
                ProCost = 96
            });
            groupData.Add(new GroupData
            {
                Id = 1004,
                TimeLine = new DateTime(2015,2,4),
                Sector = "Private Sector",
                EnerType = "Free Energy",
                EneSource = "Wind",
                PowUnits = 215,
                ProCost = 123
            });
            groupData.Add(new GroupData
            {
                Id = 1005,
                TimeLine = new DateTime(2016,3,5),
                Sector = "Public Sector",
                EnerType = "Free Energy",
                EneSource = "Wind",
                PowUnits = 263,
                ProCost = 125
            });
        }
    }
}
We recommend passing the input data source along with the pre-processed group field sets based on your grouping needs to avoid this performance constraint. For instance, if your input data includes a date field labeled “TimeLine” with a value like “15/AUG/2019 03:41 PM,” and you wish to display only the year and month, you should split the date field into “TimeLine_Year” (containing “15/AUG/2019” for the year) and “TimeLine_Month” (containing “15/AUG/2019” for the month). Additionally, utilize the PivotViewGroupSettings property to display these date fields using the chosen date format. Similarly, to group a numerical field, adjust its values according to your requirements (e.g., 1–5, 6–10).
The following code example demonstrates the grouping configuration in your input data and assigning it to the Pivot Table’s data source. Here, the fields “TimeLine_Year,” “TimeLine_Month,” and “Id” properties are created and updated within the input data. These fields are then specified for date and number grouping. Furthermore, data formatting has been applied to these selected date group fields using the PivotViewFormatSettings class.
@using Syncfusion.Blazor.PivotView
<SfPivotView TValue="GroupData" Width="1000" Height="600">
     <PivotViewDataSourceSettings DataSource="@data">
        <PivotViewColumns>
            <PivotViewColumn Name="Id"></PivotViewColumn>
        </PivotViewColumns>
        <PivotViewRows>
            <PivotViewRow Name="TimeLine"></PivotViewRow>
        </PivotViewRows>
        <PivotViewValues>
            <PivotViewValue Name="PowUnits"></PivotViewValue>
            <PivotViewValue Name="ProCost"></PivotViewValue>
        </PivotViewValues>
        <PivotViewFieldMapping>
            <PivotViewField Name="Id" DataType="number"></PivotViewField>
        </PivotViewFieldMapping>
        <PivotViewFormatSettings>
            <PivotViewFormatSetting Name="ProCost" Format="C"></PivotViewFormatSetting>
            <PivotViewFormatSetting Name="TimeLine_Year" Type="FormatType.DateTime" Format="yyyy"></PivotViewFormatSetting>
            <PivotViewFormatSetting Name="TimeLine_Month" Type="FormatType.DateTime" Format="MMM"></PivotViewFormatSetting>
        </PivotViewFormatSettings>
    </PivotViewDataSourceSettings>
</SfPivotView>
@code{
    private List<GroupData> data { get; set; }

    protected override void OnInitialized()
    {
        data = GroupData.GetGroupData();
        // Bind the data source collection here. Refer to the "Assigning sample data to the pivot table" section in the getting started document for more details.
    }
    public class GroupData
    {
        public string Id { get; set; }
        public DateTime TimeLine_Year { get; set; }
        public DateTime TimeLine_Month { get; set; }
        public string Sector { get; set; }
        public string EnerType { get; set; }
        public string EneSource { get; set; }
        public int PowUnits { get; set; }
        public int ProCost { get; set; }
        public static List<GroupData> GetGroupData()
        {
            List<GroupData> groupData = new List<GroupData>();
            groupData.Add(new GroupData
            {
                Id = "1001-1003",
                TimeLine_Year = new DateTime(2015,1,1),
                TimeLine_Month = new DateTime(2015,1,1),
                Sector = "Public Sector",
                EnerType = "Free Energy",
                EneSource = "Hydro-electric",
                PowUnits = 46,
                ProCost = 43
            });
            groupData.Add(new GroupData
            {
                Id = "1001-1003",
                TimeLine_Year = new DateTime(2015,1,2),
                TimeLine_Month = new DateTime(2015,1,1),
                Sector = "Private Sector",
                EnerType = "Free Energy",
                EneSource = "Geo-thermal",
                PowUnits = 30,
                ProCost = 29
            });
            groupData.Add(new GroupData
            {
                Id = "1001-1003",
                TimeLine_Year = new DateTime(2015,2,3),
                TimeLine_Month = new DateTime(2015,1,1),
                Sector = "Public Sector",
                EnerType = "Free Energy",
                EneSource = "Solar",
                PowUnits = 125,
                ProCost = 96
            });
            groupData.Add(new GroupData
            {
                Id = "1004-1006",
                TimeLine_Year = new DateTime(2015,2,4),
                TimeLine_Month = new DateTime(2015,1,1),
                Sector = "Private Sector",
                EnerType = "Free Energy",
                EneSource = "Wind",
                PowUnits = 215,
                ProCost = 123
            });
            groupData.Add(new GroupData
            {
                Id = "1004-1006",
                TimeLine_Year = new DateTime(2016,3,5),
                TimeLine_Month = new DateTime(2015,1,1),
                Sector = "Public Sector",
                EnerType = "Free Energy",
                EneSource = "Wind",
                PowUnits = 263,
                ProCost = 125
            });
        }
    }
}
Value filtering
Value filtering primarily operates on grand totals, meaning the filtering process considers entire rows and columns to match applied value conditions. Explore our label or member filtering options to achieve similar results flexibly. These alternates can yield similar results with better performance, especially when dealing with large datasets.
Data compression
When loading large input data (aka raw data) into the Blazor Pivot Table, you can compress the input data based on their uniqueness. Unique records will be provided as input for the Pivot Table’s data source property. The compressed data will always be used for further operations, reducing looping complexity during internal pivot calculation and improving the Pivot Table’s performance.
But there’s more! If you still have many unique rows and columns, using the AllowDataCompression and the EnableVirtualization properties is a good idea.
Best practices for utilizing data compression in Blazor Pivot Table
While data compression is a powerful tool for optimizing storage and enhancing data processing efficiency, it is essential to be aware of certain limitations that can impact its effectiveness.
1. Unique records vs. Data compression
Data compression performs exceptionally well when dealing with large input data, specifically with fewer unique records available.
The effectiveness of data compression fails when your input data is entirely made up of more unique records. In such circumstances, using data compression in the Pivot Table is not suggested because the primary goal of data compression may not be met.
2. Unsupported aggregation types
Avoid setting complex aggregation types like Average, Populationsdev, Samplestdev, Populationvar, and Samplevar to the fields available in the pivot report that may hinder the data compression process.
The result will default to the Sum aggregation type if any aggregations are utilized. This limitation is essential to remember when structuring compressed data for analytical purposes.
Server side engine
Rather than using the Blazor Pivot Table’s built-in engine to process large amounts of data, the server side engine allows performing all pivot-oriented calculations in a separate hosted web service (Web API), and only the data to be displayed in the Pivot Table’s viewport is passed to the client-side (browser). It reduces network traffic and improves the Pivot Table‘s rendering performance, especially when enabling virtual scrolling or paging. It also supports the Pivot Table‘s existing features, such as data compression, filtering, sorting, aggregation, and more.
Are there any advantages to using a server-side pivot engine over a built-in engine?
There’s a notable advantage when it comes to Blazor WebAssembly apps. The client-side engine and virtual scrolling have limitations, allowing you to bind only up to 500K records in WASM.
On the other hand, our Blazor Pivot Table, with a server-side engine featuring robust support for virtual scrolling or paging, can handle a million records in less than 12 seconds for the initial rendering in WASM. Impressive, right? Plus, it doesn’t stop there – our Blazor Pivot Table excels further, managing up to 3 million unique records effortlessly. Now, that’s efficiency at its finest!
For reference, check out the example on GitHub showing the Blazor Pivot Table using a server-side pivot engine with virtual scrolling enabled.
The following statistics were obtained using 1 million records containing 1 million unique rows and 20 columns, with the server-side engine enabled, virtual scrolling enabled, and single-page mode in the Pivot Table using Blazor WebApp with Interactive Auto mode.
|
Pivot Table actions |
Metrices for 1 million rows X 20 columns |
|
Initial rendering |
8.56 sec |
|
Drill |
9.30 sec |
|
Scrolling |
3.80 sec |
|
Sorting |
8.20 sec |
|
Filtering |
19.96 sec |
|
Aggregation |
7.60 sec |
|
Calculated Field |
8 sec |
Enhancing performance of Blazor Pivot Table in WASM apps
Improving the performance of a Blazor Pivot Table in WebAssembly (WASM) involves more than just relying on server-side pivot engines. Strategic techniques can be implemented at the app level to boost performance further.
This section explores two key aspects:
- Avoiding unnecessary component rendering and
- Optimizing rendering after Pivot Table events.
Avoiding unnecessary component rendering
One critical factor impacting the performance of a Blazor Pivot Table in a WebAssembly app is unnecessary component rendering. The Blazor diffing algorithm examines every cell of the Pivot Table component and its child components for potential re-rendering. For instance, having an EventCallBack on the app or Pivot Table triggers a check for every child component once the event callback is completed.
The PreventRender method can be employed to exercise fine-grained control over Pivot Table rendering. This method prevents unnecessary re-rendering by internally overriding the ShouldRender method of the Pivot Table.
In the following example, the PreventRender method is invoked within the IncrementCount method, acting as a callback for a click event. This strategic implementation ensures that when the IncrementCount method is triggered, the rendering process selectively excludes the Pivot Table component. As a result, only the currentCount is updated, optimizing the efficiency of the user interface.
@using Syncfusion.Blazor.PivotView
<h1>Counter</h1>
<p>Current Count: @currentCount</p>
<button class="btn btn-primary" @onclick="IncrementCount">Click me</button>
<SfPivotView @ref="pivot" TValue="ProductDetails">
     <PivotViewDataSourceSettings DataSource="@data">
        <PivotViewColumns>
            <PivotViewColumn Name="Year"></PivotViewColumn>
            <PivotViewColumn Name="Quarter"></PivotViewColumn>
        </PivotViewColumns>
        <PivotViewRows>
            <PivotViewRow Name="Country"></PivotViewRow>
            <PivotViewRow Name="Products"></PivotViewRow>
        </PivotViewRows>
        <PivotViewValues>
            <PivotViewValue Name="Sold" Caption="Unit Sold"></PivotViewValue>
            <PivotViewValue Name="Amount" Caption="Sold Amount"></PivotViewValue>
        </PivotViewValues>
        <PivotViewFormatSettings>
            <PivotViewFormatSetting Name="Amount" Format="C"></PivotViewFormatSetting>
        </PivotViewFormatSettings>
    </PivotViewDataSourceSettings>
</SfPivotView>
@code{
    private List<ProductDetails> data { get; set; }
    private SfPivotView<ProductDetails> pivot;
    private int currentCount = 0;

    protected override void OnInitialized()
    {
        data = ProductDetails.GetProductData().ToList();
        // Bind the data source collection here. Refer to the "Assigning sample data to the pivot table" section in the getting started document for more details.
    }
    private void IncrementCount()
    {
        pivot.PreventRender();
        currentCount++;
    }
    public class ProductDetails
    {
        public int Sold { get; set; }
        public double Amount { get; set; }
        public string Country { get; set; }
        public string Products { get; set; }
        public string Year { get; set; }
        public string Quarter { get; set; }
    }
}
Points to be noted:
- The PreventRender method takes a Boolean argument (true or false) to turn rendering on or off.
- Usage is recommended after the Blazor Pivot Table’s initial rendering; applying it during the initial rendering phase will have no effect.
Reduce unnecessary rendering after Pivot Table events
Another area to address is the rendering that occurs after Pivot Table events. When a callback method is assigned to a Pivot Table event, the parent component automatically invokes its StateHasChanged method when the event concludes. To prevent this automatic re-rendering of the Blazor Pivot Table component, we can employ the PreventRender method.
In the following example, the Drill event is bound to a callback method, prompting the invocation of the StateHasChanged method for the parent component upon completion. Setting the SfPivotView<ProductDetails>.PreventRender method to true ensures that the Pivot Table remains unaffected by the StateHasChanged method triggered by the Pivot Table action.
@using Syncfusion.Blazor.PivotView
<SfPivotView TValue="ProductDetails" AllowConditionalFormatting="true">
    <PivotViewDataSourceSettings DataSource="@data">
        <PivotViewColumns>
            <PivotViewColumn Name="Year"></PivotViewColumn>
            <PivotViewColumn Name="Quarter"></PivotViewColumn>
        </PivotViewColumns>
        <PivotViewRows>
            <PivotViewRow Name="Country"></PivotViewRow>
            <PivotViewRow Name="Products"></PivotViewRow>
        </PivotViewRows>
        <PivotViewValues>
            <PivotViewValue Name="Sold" Caption="Unit Sold"></PivotViewValue>
            <PivotViewValue Name="Amount" Caption="Amount"></PivotViewValue>
        </PivotViewValues>
    </PivotViewDataSourceSettings>
    <PivotViewEvents TValue="ProductDetails" Drill="Drill" DataBound="DataBound"></PivotViewEvents>
</SfPivotView>
@code {
    public List<ProductDetails> data { get; set; }
    private SfPivotView<ProductDetails> pivot;
    protected override void OnInitialized()
    {
        this.data = ProductDetails.GetProductData().ToList();
        // Bind the data source collection here. Refer to the "Assigning sample data to the pivot table" section in the getting started document for more details.
    }
    private void Drill(DrillArgs<ProductDetails> args)
    {
        pivot.PreventRender(true);
    }
    private void DataBound()
    {
        pivot.PreventRender(false);
    }
    public class ProductDetails
    {
        public int Sold { get; set; }
        public double Amount { get; set; }
        public string Country { get; set; }
        public string Products { get; set; }
        public string Year { get; set; }
        public string Quarter { get; set; }
    }
}
Key insights:
- The PreventRender method internally overrides the component’s ShouldRender method to prevent rendering.
- For optimal performance, Use the PreventRender method for user interactive events like Drill, BeforeColumnsRender, BeforeExport, DrillThrough, CellClick, ChartSeriesCreated, and more.
- For events without arguments like DataBound, leverage the PreventRender method to disable rendering.
Implementing these practices, based on Blazor WebAssembly app performance guidelines, can significantly enhance the efficiency of Blazor Pivot Table.
Strategic approaches to addressing latency challenges
Your situation has been reviewed to understand your concerns regarding the lagging responsiveness of the Syncfusion Blazor Pivot Table, and several factors contributing to this issue have been identified. It’s important to note that when using dialog-oriented features like filtering and drill-through, a call is made from the client to the server, resulting in some delay if the servers are located in a distant location.
Network latency: When the server is in a different region, the increased distance between the client and server leads to higher latency, impacting the responsiveness of client-server communication.
Solution: Host the server in a region closer to most users to reduce network latency. Choosing a server location nearer to your target audience can significantly improve response times.
For more information, refer to the hosting and deploying Blazor apps documentation.
Reference links
For more details, refer to the Getting started with Blazor Pivot Table in the Blazor Web App documentation.

Conclusion
Thanks for reading this blog! Dive deeper into the capabilities of Syncfusion Blazor Pivot Table and witness how it elevates your data analysis experience. By implementing our recommended best practices, you ensure seamless performance and gain quicker insights, benefiting developers and business users. Try out them and share your valuable feedback in the comments section below!
For our existing customers, the new version of Essential Studio® is readily available on the License and Downloads page, enabling you to stay at the forefront of innovation. If you’re new to Syncfusion, sign up for our 30-day free trial to explore the full spectrum of our features.
Should you have any inquiries or require assistance, our dedicated support forum, support portal, or feedback portal is always available. We’re committed to ensuring your success every step of the way!


 No spam, just valuable updates.