TL;DR: Explore the advanced PDF exporting capabilities of Syncfusion Angular Pivot Table along with customization. Learn to generate highly customized PDF reports with step-by-step guidance. We have covered essential topics like PDF export, exporting with other Syncfusion components, customizing PDFs, varying page sizes, changing table styles, and additional export options.
Syncfusion Angular Pivot Table is a feature-rich component designed to analyze large data sets, create insightful reports, and effortlessly make data-driven decisions. It offers various functionalities, including data aggregation, filtering, sorting, and pivot calculations. One of its most significant strengths is its ability to export Pivot Table data to various formats, including PDF.
This blog will explore Syncfusion Angular Pivot Table’s advanced PDF exporting options and their customization. We will provide a step-by-step guide to unlock its full potential and help you generate highly customized and visually appealing PDF reports.
Exporting data to PDF is a common requirement for many businesses and organizations. However, the default PDF output may sometimes match your branding or presentation needs. Customizing the PDF export ensures that the generated report aligns with your organization’s style and delivers a professional appearance. With Syncfusion Angular Pivot Table, you can unlock a world of possibilities for customizing the PDF export to match your requirements.
Before exporting and customizing PDFs, integrate the Syncfusion Pivot Table into your Angular app or project.
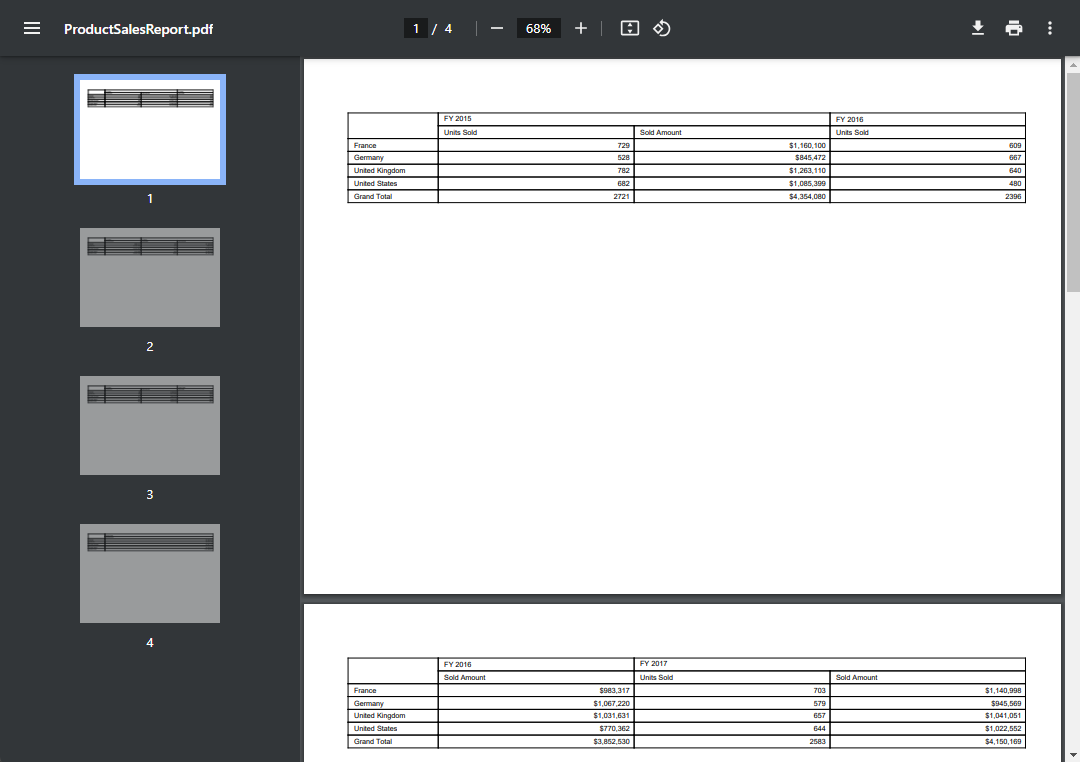
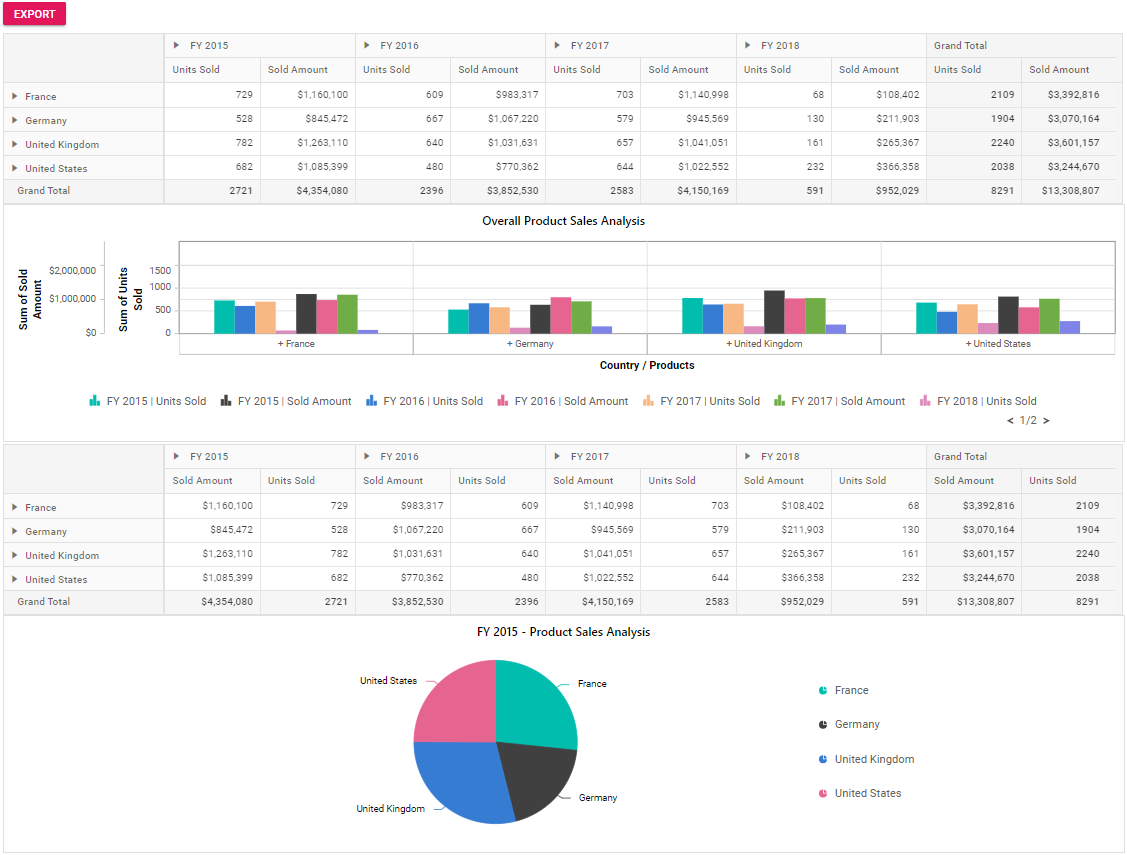
Creating PDF exports with Syncfusion Angular Pivot Table is easy. Set the allowPdfExport property to true during initialization and inject the PDFExportService module.
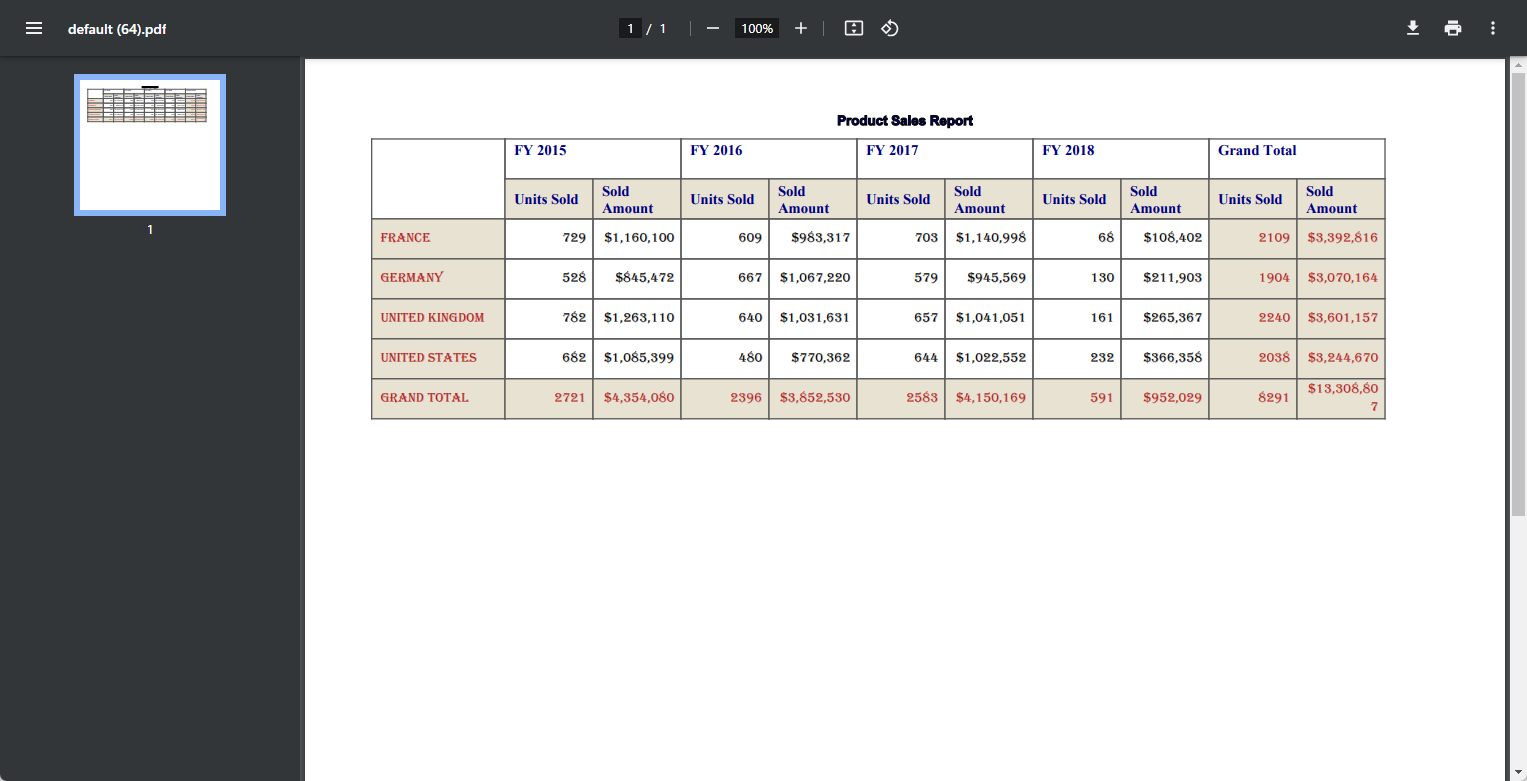
Once you’ve completed the setup, click the Export button to generate the PDF. This triggers the pdfExport method, which exports the Pivot Table’s data into a PDF document named ProductSalesReport.pdf. You can customize the file name by setting the fileName property within the pdfExportProperties object.
Refer to the following code example.
import { Component, OnInit, ViewChild } from '@angular/core';
import { IDataOptions, IDataSet, PivotView, PDFExportService } from '@syncfusion/ej2-angular-pivotview';
import { Button } from '@syncfusion/ej2-buttons';
import { pivot_Data } from '../data';
@Component({
  selector: 'app-container',
 providers: [PDFExportService],
  template: `<div class="col-md-8">
  <ejs-pivotview #pivotview id='PivotView' height='350' [dataSourceSettings]=dataSourceSettings allowPdfExport='true' width=width></ejs-pivotview></div>
  <div class="col-md-2"><button ej-button id='export'>Export</button></div>`
})
export class ExportingComponent implements OnInit {
  public width: string;
  public dataSourceSettings: IDataOptions;
  public button: Button;
    @ViewChild('pivotview', {static: false})
    public pivotGridObj: PivotView;
    ngOnInit(): void {
        this.width = "100%";
        this.dataSourceSettings = {
          dataSource: pivot_Data as IDataSet[],
            expandAll: false,
            columns: [{ name: 'Year', caption: 'Production Year' }, { name: 'Quarter' }],
            values: [{ name: 'Sold', caption: 'Units Sold' }, { name: 'Amount', caption: 'Sold Amount' }],
            rows: [{ name: 'Country' }, { name: 'Products' }],
            formatSettings: [{ name: 'Amount', format: 'C0' }],

        };
        this.button = new Button({ isPrimary: true });
        this.button.appendTo('#export');
        this.button.element.onclick = (): void => {
            this.pivotGridObj.pdfExport();
        };
    }
}
Refer to the following image.
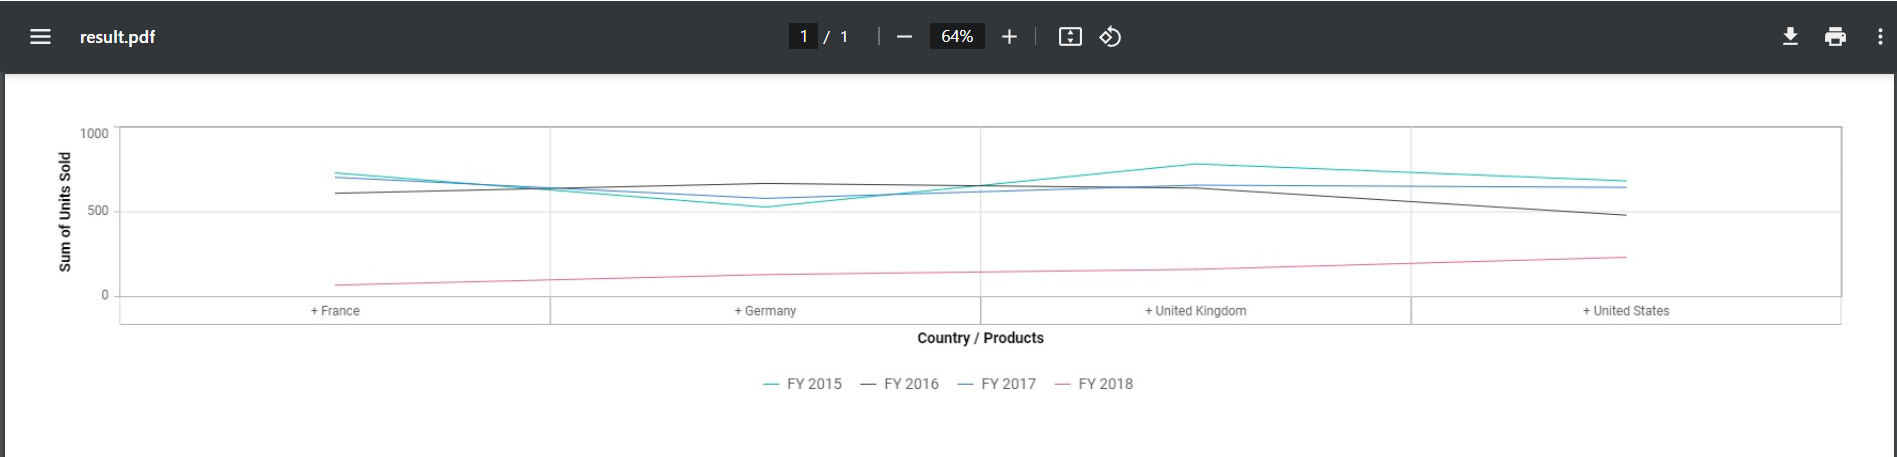
Like the Pivot Table data, the pivot chart feature offers seamless export capabilities through the chartExport method.
The following code example enables the pivot chart view by configuring the displayOption->view property to Chart. Clicking the Export button triggers the chartExport method with the type as PDF. We can now download the pivot chart as a PDF document.
Refer to the following code example.
import { Component, OnInit, ViewChild } from '@angular/core';
import { IDataOptions, PivotView, PDFExportService, DisplayOption, IDataSet } from '@syncfusion/ej2-angular-pivotview';
import { Button } from '@syncfusion/ej2-buttons';
import { pivot_Data } from '../data';
@Component({
  selector: 'app-container',
  providers: [PDFExportService],
  templateUrl: `<h4>Default exporting</h4>
  <div class="col-md-2"><button ej-button id='export'>Export</button></div>
  <div class="col-md-8">
      <ejs-pivotview #pivotview height='300' width='750' [dataSourceSettings]=dataSourceSettings allowPdfExport='true'
      [displayOption]='displayOption' width=width (load)='load()'></ejs-pivotview>
  </div>`
})
export class PivotChartExportingComponent implements OnInit {
    public width: string;
    public dataSourceSettings: IDataOptions;
    public displayOption: DisplayOption;
    public button: Button;
    @ViewChild('pivotview', {static: false})
    public pivotGridObj: PivotView;
    load() {
        this.pivotGridObj.allowEngineExport = true;
    }
    ngOnInit(): void {
        this.dataSourceSettings = {
            dataSource: pivot_Data as IDataSet[],
            columns: [{ name: 'Year', caption: 'Production Year' }],
            values: [{ name: 'Sold', caption: 'Units Sold' }, { name: 'Amount', caption: 'Sold Amount' }],
            rows: [{ name: 'Country' }, { name: 'Products' }],
            formatSettings: [{ name: 'Amount', format: 'C0' }],

        };
        this.width = '100%';
        this.displayOption = { view: 'Chart' } as DisplayOption;
        this.button = new Button({ isPrimary: true });
        this.button.appendTo('#export');
        this.button.element.onclick = (): void => {
             let pdfExportProperties: PdfExportProperties = { fileName: 'result' };
              this.pivotGridObj.chartExport('PDF', pdfExportProperties);
        };
    }
}
Refer to the following image.
The Syncfusion Angular Pivot Table offers advanced settings for granular control over the PDF export process. These options allow you to customize various aspects of the PDF report, including layout, style, and data, to elevate the look and feel of your PDF document. Let’s see these options one by one.
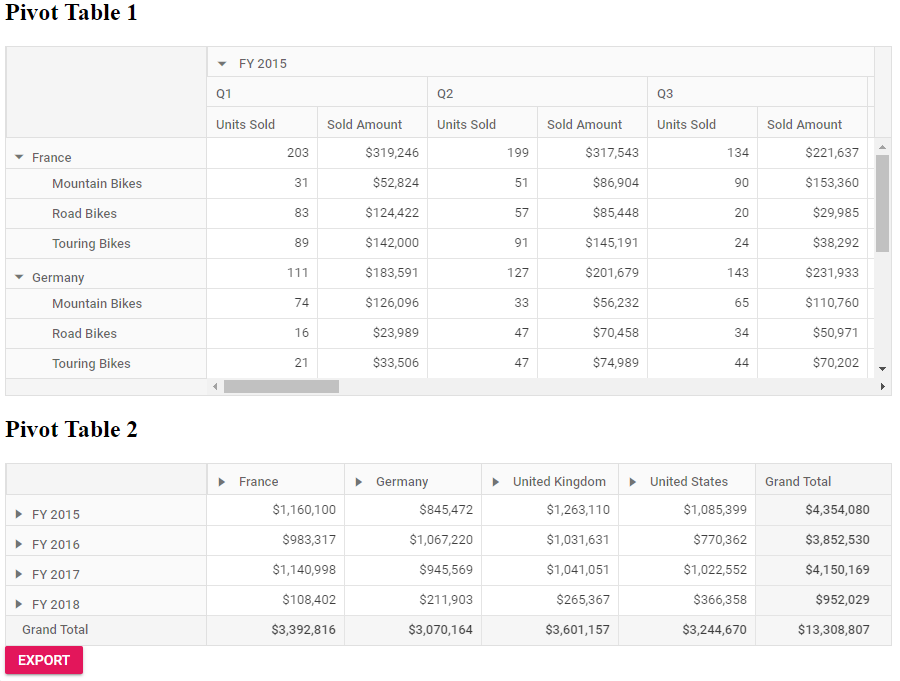
Efficiently export multiple Pivot Tables to a single PDF document by enabling the isMultipleExport option in the pdfExport method.
Here’s a simple scenario with a code example. Imagine you have two Pivot Tables named Pivot Table 1 and Pivot Table 2 on the same webpage, functioning as separate components.
When the Export button is clicked, the data from Pivot Table 1 is exported as a PDF object using the isMultipleExport option in the pdfExport method. This exported data is then stored in the variable firstGridPdfExport.
Instead of generating a new PDF for Pivot Table 2, we reuse the existing PDF document stored in the variable firstGridPdfExport. This is achieved by passing the firstGridPdfExport variable to the pdfExport method for Pivot Table 2, which appends the second data set to the same PDF document.
This approach creates a consolidated PDF document containing Pivot Table 1 and Pivot Table 2, with each table placed on a separate page within the PDF for an organized report. This efficient method allows you to export multiple Pivot Tables without the hassle of managing separate PDF documents, streamlining your workflow.
import { Component, OnInit, ViewChild } from '@angular/core';
import { IDataOptions, IDataSet, PivotView, PDFExportService } from '@syncfusion/ej2-angular-pivotview';
import { ChartSettings } from '@syncfusion/ej2-pivotview/src/pivotview/model/chartsettings';
import { Button } from '@syncfusion/ej2-buttons';
import { pivot_Data } from '../data';

@Component({
  selector: 'app-container',
  providers: [PDFExportService],
  template: `<div class="col-md-8"><h2>Pivot Table 1</h2>
  <ejs-pivotview #pivotview height='350' [dataSourceSettings]=dataSourceSettings allowPdfExport='true' width=width></ejs-pivotview>
  <h2>Pivot Table 2</h2>
  <ejs-pivotview #pivotview1 [dataSourceSettings]=dataSourceSettings1 allowPdfExport='true' width=width></ejs-pivotview></div>
  <div class="col-md-2"><button ej-button id='export'>Export</button></div>`
})

export class MultipleExportingComponent implements OnInit {
  public width: string;
  public dataSourceSettings: IDataOptions;
  public dataSourceSettings1: IDataOptions;
  public button: Button;
  public firstGridPdfExport: Promise<Object>;

    @ViewChild('pivotview', {static: false})
    public pivotGridObj: PivotView;

    @ViewChild('pivotview1')
    public pivotGridObj1: PivotView;

    ngOnInit(): void {
        this.width = "100%";
        this.dataSourceSettings = {
          dataSource: pivot_Data as IDataSet[],
            expandAll: false,
            columns: [{ name: 'Year', caption: 'Production Year' }, { name: 'Quarter' }],
            values: [{ name: 'Sold', caption: 'Units Sold' }, { name: 'Amount', caption: 'Sold Amount' }],
            rows: [{ name: 'Country' }, { name: 'Products' }],
            formatSettings: [{ name: 'Amount', format: 'C0' }],
            filters: [],
            valueSortSettings: { headerText: 'FY 2015##Q1##Amount', headerDelimiter: '##', sortOrder: 'Descending' }
        };

        this.dataSourceSettings1 = {
          dataSource: pivot_Data as IDataSet[],
            expandAll: false,
            rows: [{ name: 'Year', caption: 'Production Year' }, { name: 'Quarter' }],
            values: [{ name: 'Amount', caption: 'Sold Amount' }],
            columns: [{ name: 'Country' }, { name: 'Products' }],
            formatSettings: [{ name: 'Amount', format: 'C0' }],

        };

        this.button = new Button({ isPrimary: true });
        this.button.appendTo('#export');

        this.button.element.onclick = (): void => {
            this.firstGridPdfExport = this.pivotGridObj.pdfExport({}, true);
            this.firstGridPdfExport.then((pdfData: Object) => {
                this.pivotGridObj1.pdfExport({}, false, pdfData);
            });
        };
    }
}
Refer to the following image.
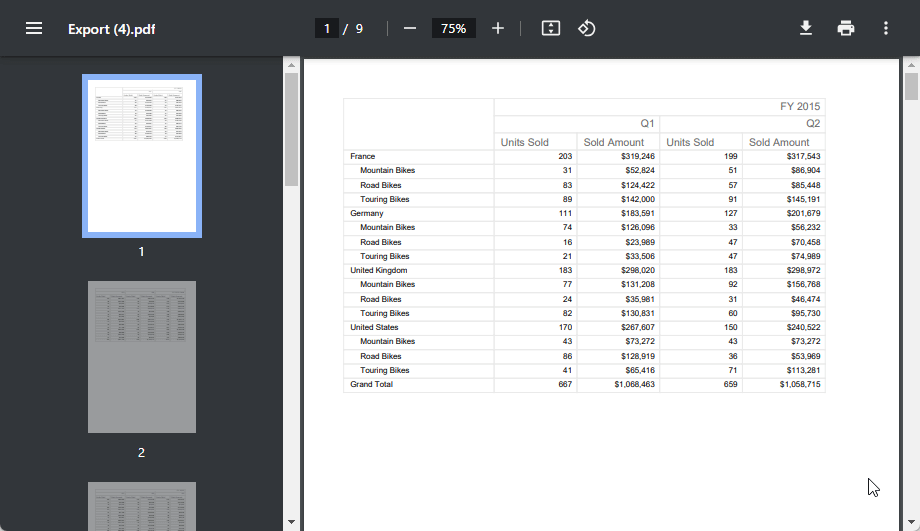
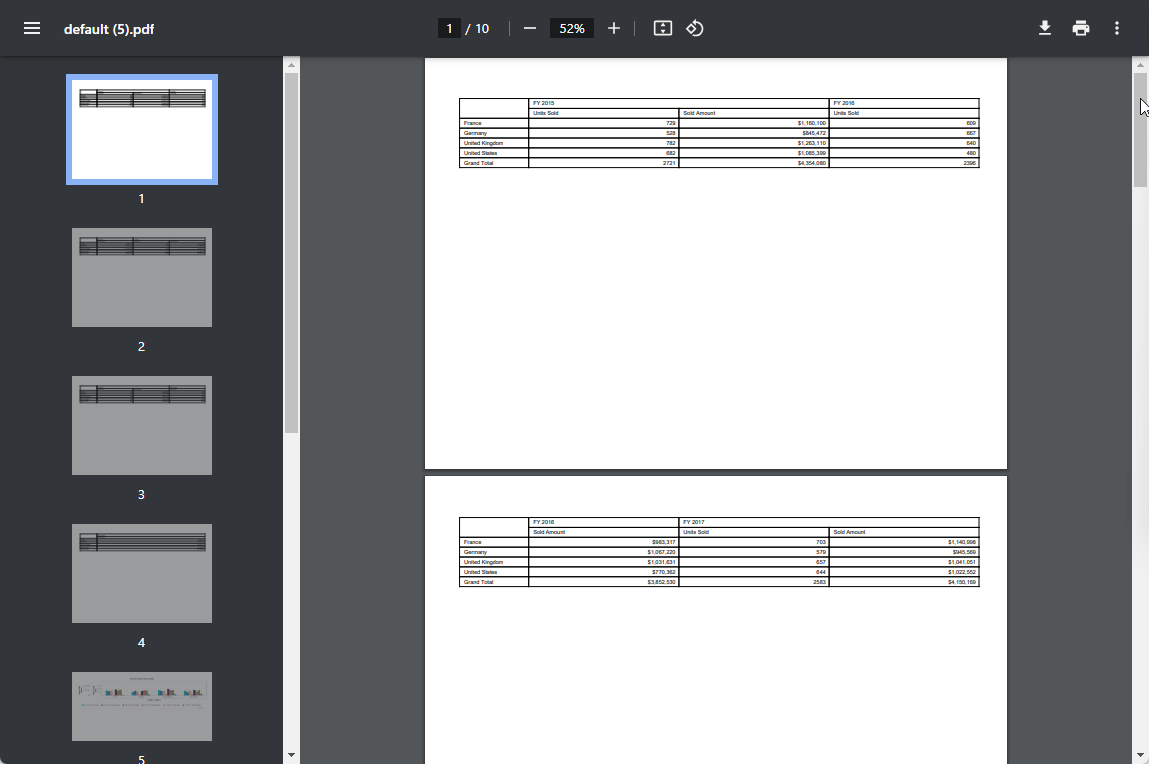
In the following image, Pivot Table 1 is exported to page 1, while Pivot Table 2 is exported to the following page.
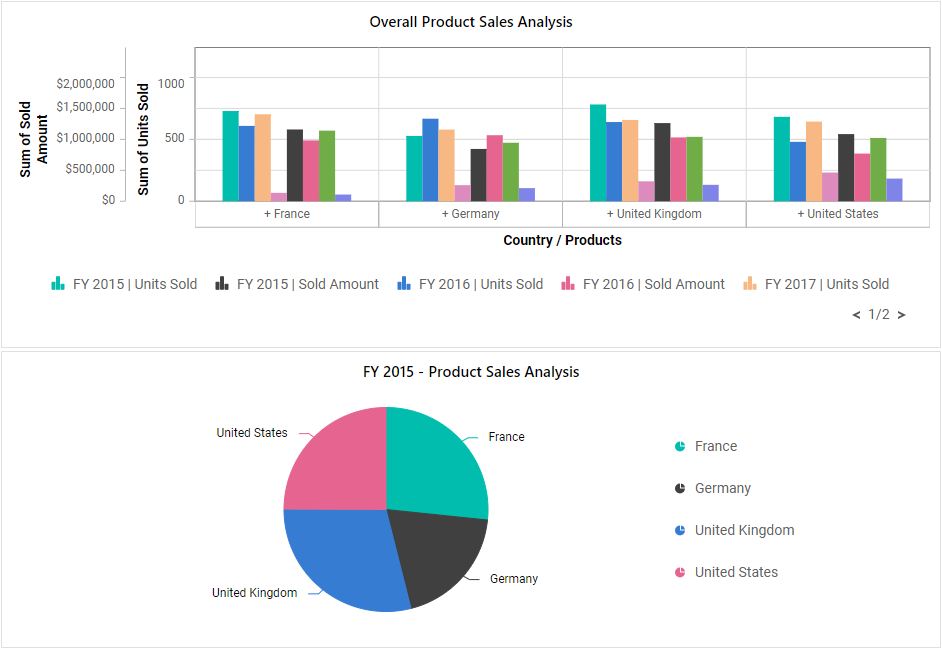
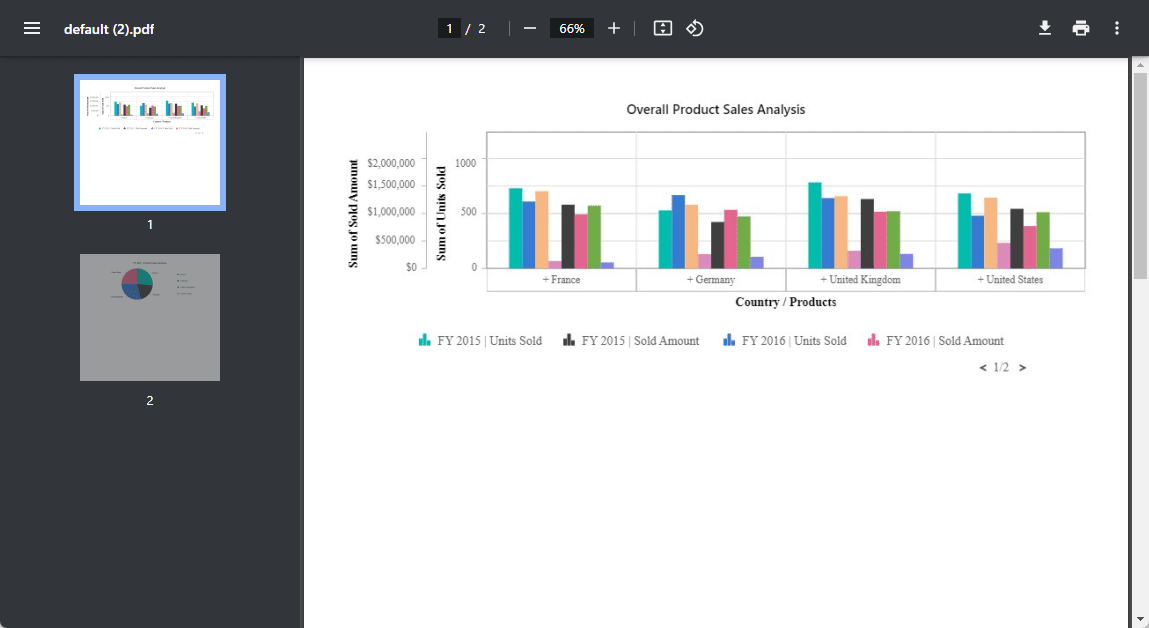
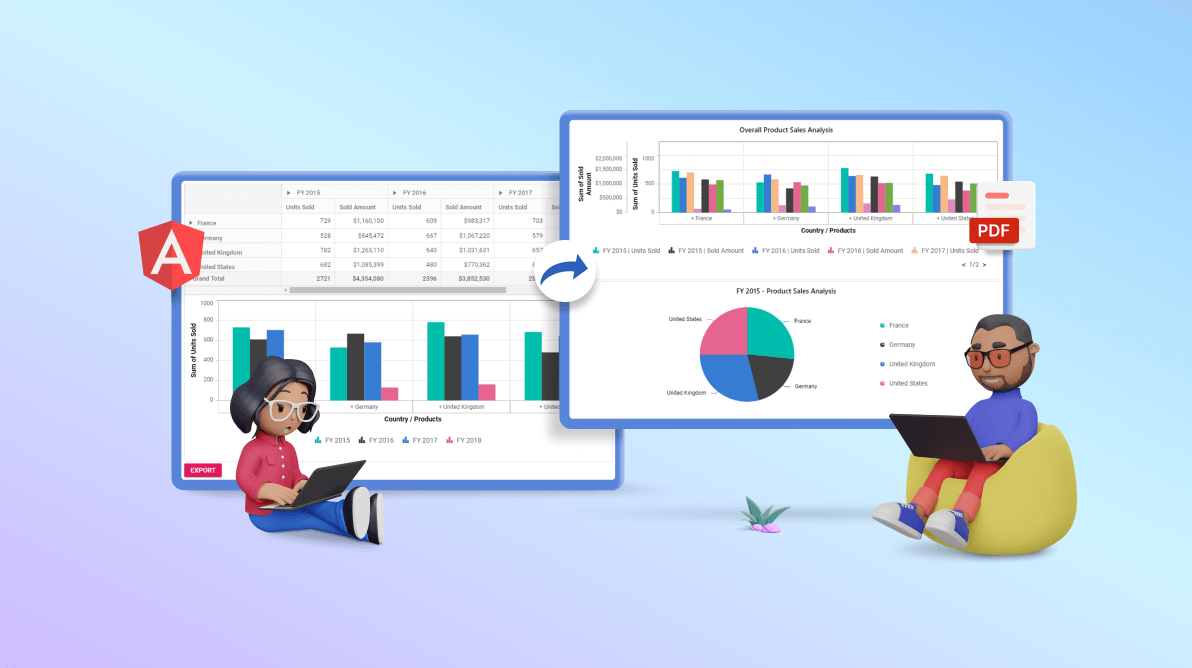
You can also export a PDF document with multiple Pivot Charts using the chartExport method. In this example, we’ve crafted two pivot charts to view product sales data comprehensively. The first chart analyzes sales across countries, while the second focuses on product sales in various countries, specifically for the fiscal year 2015.
When you click the Export button, it triggers the chartExport method with the isMultipleExport option. This method converts the first pivot chart into a PDF document and stores it in the firstChartPdfExport variable. Now, pass this variable in the chartExport method to export it along with the second Pivot Chart.
The result is a consolidated PDF document containing both charts. The first chart on page 1 provides a global sales overview. The second chart, on the following page, showcases specific product sales for the fiscal year 2015.
Refer to the following code example.
import { Component, OnInit, ViewChild } from '@angular/core';
import { IDataOptions, IDataSet, PivotView, PDFExportService, DisplayOption } from '@syncfusion/ej2-angular-pivotview';
import { ChartSettings } from '@syncfusion/ej2-pivotview/src/pivotview/model/chartsettings';
import { Button } from '@syncfusion/ej2-buttons';
import { pivot_Data } from '../data';

@Component({
  selector: 'app-container',
  providers: [PDFExportService],
  styleUrls: ['multiple-pivotchart-exporting.component.css'],
  templateUrl: `<h4>Multiple export</h4>
  <div class="col-md-2"><button ej-button id='export-btn'>Export</button></div>
  <div class="col-md-8">
      <ejs-pivotview #pivotview height='350' [dataSourceSettings]=dataSourceSettings allowPdfExport='true'
          (load)='load()' width=width [displayOption]='displayOption' [chartSettings]='chartSettings'></ejs-pivotview>
      <ejs-pivotview #pivotview1 [dataSourceSettings]=dataSourceSettings1 allowPdfExport='true'
          (load)='load1()'width=width [displayOption]='displayOption' [chartSettings]='chartSettings1'></ejs-pivotview>
  </div>`
})

export class MultiplePivotChartExportingComponent implements OnInit {
  public width: string;
  public dataSourceSettings: IDataOptions;
  public dataSourceSettings1: IDataOptions;
  public displayOption: DisplayOption;
  public chartSettings?: ChartSettings;
  public chartSettings1?: ChartSettings;
  public button: Button;
  public firstChartPdfExport: Promise<Object>;

    @ViewChild('pivotchart', {static: false})
    public pivotChartObj: PivotView;

    @ViewChild('pivotchart1')
    public pivotChartObj1: PivotView;

    load() {
      this.pivotChartObj.allowEngineExport = true;
    }

    load1() {
      this.pivotChartObj1.allowEngineExport = true;
    }

    ngOnInit(): void {
        this.width = "100%";
        this.dataSourceSettings = {
          dataSource: pivot_Data as IDataSet[],
            expandAll: false,
            columns: [{ name: 'Year', caption: 'Production Year' }, { name: 'Quarter' }],
            values: [{ name: 'Sold', caption: 'Units Sold' }, { name: 'Amount', caption: 'Sold Amount' }],
            rows: [{ name: 'Country' }, { name: 'Products' }],
            formatSettings: [{ name: 'Amount', format: 'C0' }],

        };

        this.dataSourceSettings1 = {
          dataSource: pivot_Data as IDataSet[],
            expandAll: false,
            columns: [{ name: 'Year', caption: 'Production Year' }, { name: 'Quarter' }],
            values: [{ name: 'Amount', caption: 'Sold Amount' }, { name: 'Sold', caption: 'Units Sold' }],
            rows: [{ name: 'Country' }, { name: 'Products' }],
            formatSettings: [{ name: 'Amount', format: 'C0' }],

        };

        this.displayOption = { view: 'Chart' } as DisplayOption;
        this.chartSettings = { title: 'Overall Product Sales Analysis', enableMultipleAxis: true, multipleAxisMode : 'Single', chartSeries: { type: 'Column' },} as ChartSettings;
        this.chartSettings1 = { title: 'FY 2015 - Product Sales Analysis', chartSeries: { type: 'Pie' },} as ChartSettings;
        this.button = new Button({ isPrimary: true });
        this.button.appendTo('#export-btn');

        this.button.element.onclick = (): void => {
            this.firstChartPdfExport = this.pivotChartObj.chartExport('PDF', {}, true);
            this.firstChartPdfExport.then((pdfData: Object) => {
                this.pivotChartObj1.chartExport('PDF', {}, false, pdfData);
            });
        };
    }
}
Refer to the following images.
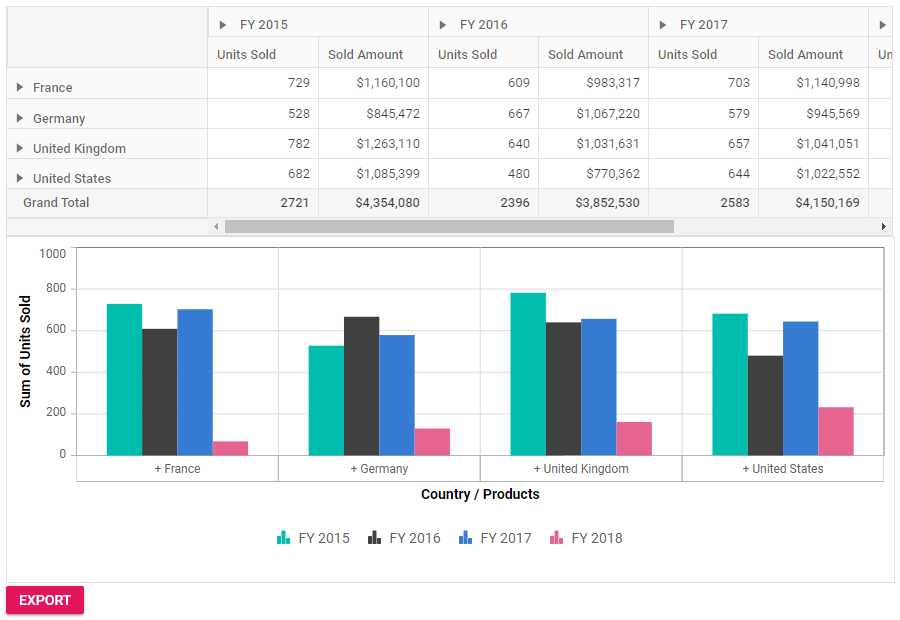
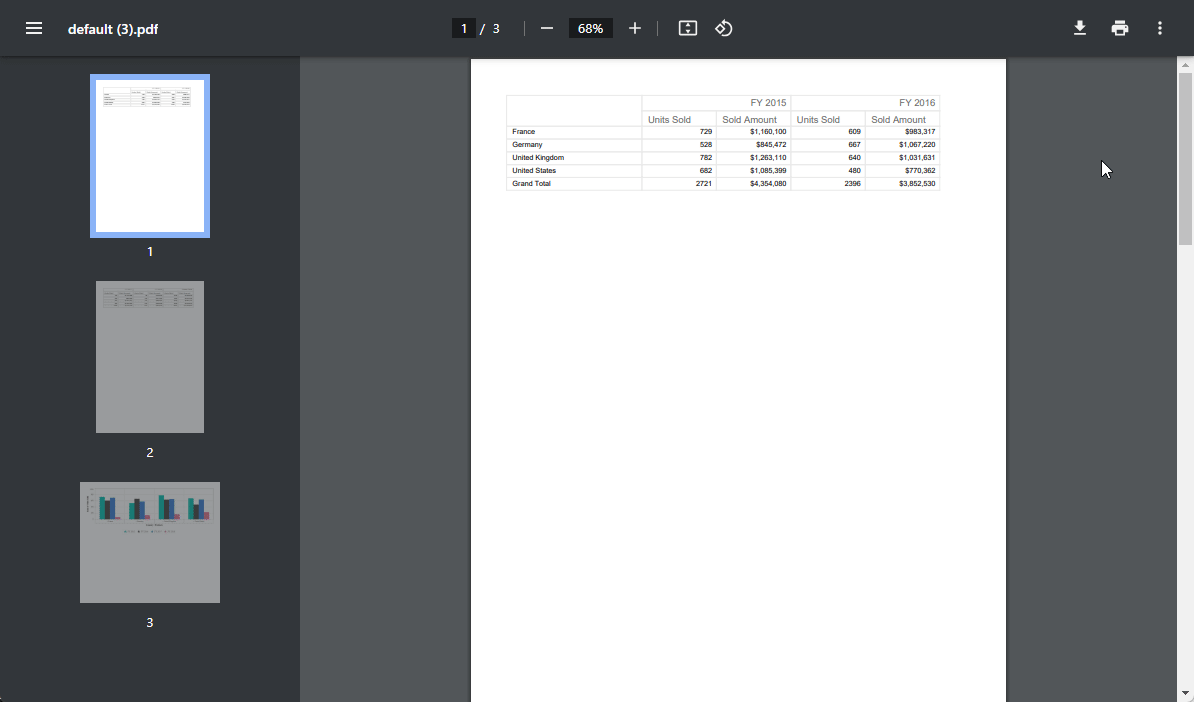
In data analysis, pivot tables and pivot charts are indispensable tools. You can effortlessly combine and export these components into a single PDF document.
First, set the Pivot Table component instance’s display option to Both. This configuration allows you to show the table and chart on the same web page. Once done, click the Export button, which triggers the pdfExport method with the exportBothTableAndChart option. This will export the table and chart views into a single PDF document.
Refer to the following code example.
import { Component, OnInit, ViewChild } from '@angular/core';
import { IDataOptions, PivotView, PDFExportService, DisplayOption, IDataSet } from '@syncfusion/ej2-angular-pivotview';
import { ChartSettings } from '@syncfusion/ej2-pivotview/src/pivotview/model/chartsettings';
import { Button } from '@syncfusion/ej2-buttons';
import { pivot_Data } from '../data';

@Component({
  selector: 'app-container',
  providers: [PDFExportService],
  template: `<div class="col-md-8">
  <ejs-pivotview #pivotview id='PivotView' height='350'
  [dataSourceSettings]=dataSourceSettings allowPdfExport='true'
  [displayOption]='displayOption' [chartSettings]='chartSettings' width=width></ejs-pivotview></div>
  <div class="col-md-2"><button ej-button id='export'>Export</button></div>`
})

export class TableAndChartExportComponent implements OnInit {
    public width: string;
    public dataSourceSettings: IDataOptions;
    public displayOption: DisplayOption;
    public chartSettings: ChartSettings;
    public button: Button;

    @ViewChild('pivotview', {static: false})
    public pivotGridObj: PivotView;

    ngOnInit(): void {
        this.dataSourceSettings = {
            dataSource: pivot_Data as IDataSet[],
            expandAll: true,
            columns: [{ name: 'Year', caption: 'Production Year' }, { name: 'Quarter' }],
            rows: [{ name: 'Country' }, { name: 'Products' }],
            values: [{ name: 'Sold', caption: 'Units Sold' }, { name: 'Amount', caption: 'Sold Amount' }],
            formatSettings: [{ name: 'Amount', format: 'C0' }],
            filters: []
        };
        this.width = '100%';
        this.displayOption = { view: 'Both' } as DisplayOption;
        this.chartSettings = { chartSeries: { type: 'Column' }} as ChartSettings;
        this.button = new Button({ isPrimary: true });
        this.button.appendTo('#export');
        this.button.element.onclick = (): void => {
            this.pivotGridObj.pdfExport({}, false, undefined, false, true);
        };
    }
}
Refer to the following images.
You can also export multiple pivot tables and charts separately using the pdfExport and chartExport methods. The following code example illustrates how to export multiple pivot tables and pivot charts from a browser page as separate components.
import { Component, OnInit, ViewChild } from '@angular/core';
import { IDataOptions, IDataSet, PivotView, PDFExportService, DisplayOption } from '@syncfusion/ej2-angular-pivotview';
import { ChartSettings } from '@syncfusion/ej2-pivotview/src/pivotview/model/chartsettings';
import { Button } from '@syncfusion/ej2-buttons';
import { pivot_Data } from '../data';

@Component({
  selector: 'app-container',
  providers: [PDFExportService],
  styleUrls: ['pivottable-pivotchart-exporting.component.css'],
  templateUrl: `<h4>Multiple export</h4>
  <div class="col-md-2"><button ej-button id='export-btn'>Export</button></div>
  <div class="col-md-8">
      <ejs-pivotview #pivotview  height='350' [dataSourceSettings]=dataSourceSettings allowPdfExport='true'
          (load)='load()' width=width></ejs-pivotview>
      <ejs-pivotview #pivotview1  [dataSourceSettings]=dataSourceSettings1 allowPdfExport='true'
          (load)='load1()'width=width [displayOption]='displayOption1' [chartSettings]='chartSettings1'></ejs-pivotview>
      <ejs-pivotview #pivotview2 [dataSourceSettings]=dataSourceSettings2 allowPdfExport='true'
          (load)='load2()'width=width [displayOption]='displayOption2' [chartSettings]='chartSettings2'></ejs-pivotview>
  </div>`
})

export class MultipleTableChartExportingComponent implements OnInit {
  public width: string;
  public dataSourceSettings: IDataOptions;
  public dataSourceSettings1: IDataOptions;
  public dataSourceSettings2: IDataOptions;
  public displayOption1: DisplayOption;
  public displayOption2: DisplayOption;
  public chartSettings1?: ChartSettings;
  public chartSettings2?: ChartSettings;
  public button: Button;
  public pivotGridPdfExport: Promise<Object>;
  public pivotChartPdfExport: Promise<Object>;
    @ViewChild('pivotview', {static: false})
    public pivotGridObj: PivotView;

    @ViewChild('pivotview1')
    public pivotChartObj: PivotView;

    @ViewChild('pivotview2')
    public pivotGridObj2: PivotView;

    load() {
      this.pivotGridObj.allowEngineExport = true;
    }

    load1() {
      this.pivotChartObj.allowEngineExport = true;
    }

    load2() {
      this.pivotGridObj2.allowEngineExport = true;
    }

    ngOnInit(): void {
        this.width = "100%";
        this.dataSourceSettings = {
          dataSource: pivot_Data as IDataSet[],
            expandAll: false,
            columns: [{ name: 'Year', caption: 'Production Year' }, { name: 'Quarter' }],
            values: [{ name: 'Sold', caption: 'Units Sold' }, { name: 'Amount', caption: 'Sold Amount' }],
            rows: [{ name: 'Country' }, { name: 'Products' }],
            formatSettings: [{ name: 'Amount', format: 'C0' }],
        };

        this.dataSourceSettings1 = {
          dataSource: pivot_Data as IDataSet[],
            expandAll: false,
            columns: [{ name: 'Year', caption: 'Production Year' }, { name: 'Quarter' }],
            values: [{ name: 'Sold', caption: 'Units Sold' }, { name: 'Amount', caption: 'Sold Amount' }],
            rows: [{ name: 'Country' }, { name: 'Products' }],
            formatSettings: [{ name: 'Amount', format: 'C0' }],
        };

        this.dataSourceSettings2 = {
          dataSource: pivot_Data as IDataSet[],
            expandAll: false,
            columns: [{ name: 'Year', caption: 'Production Year' }, { name: 'Quarter' }],
            values: [{ name: 'Amount', caption: 'Sold Amount' }, { name: 'Sold', caption: 'Units Sold' }],
            rows: [{ name: 'Country' }, { name: 'Products' }],
            formatSettings: [{ name: 'Amount', format: 'C0' }],
            filters: []
        };

        this.displayOption1 = { view: 'Chart' } as DisplayOption;
        this.displayOption2 = { view: 'Both' } as DisplayOption;
        this.chartSettings1 = { title: 'Overall Product Sales Analysis', enableMultipleAxis: true, multipleAxisMode : 'Single', chartSeries: { type: 'Column' },} as ChartSettings;
        this.chartSettings2 = { title: 'FY 2015 - Product Sales Analysis', chartSeries: { type: 'Pie' },} as ChartSettings;

        this.button = new Button({ isPrimary: true });
        this.button.appendTo('#export-btn');

        this.button.element.onclick = (): void => {
            this.pivotGridPdfExport = this.pivotGridObj.pdfExport({}, true);
            this.pivotGridPdfExport.then((pdfData: Object) => {
              this.pivotChartPdfExport = this.pivotChartObj.chartExport('PDF', {}, true, pdfData);
              this.pivotChartPdfExport.then((pdfData: Object) => {
                this.pivotGridObj2.pdfExport({}, false, pdfData, false, true);
              });
            });
        };
    }
}
Refer to the following images.
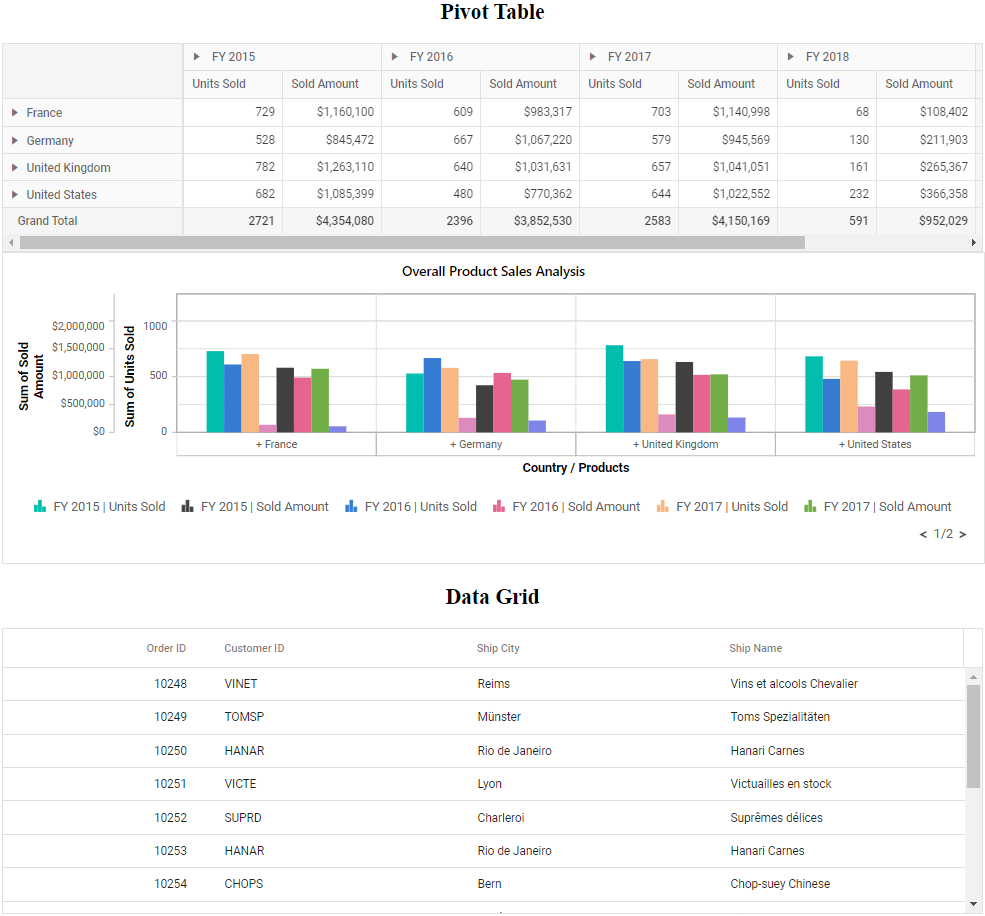
Exporting other Syncfusion components in the Pivot Table to a PDF document is seamless. This allows you to save and share data effortlessly. Whether it’s a pivot table, a data grid, or any other Syncfusion component, you can easily export its data and store it in a single PDF document.
Imagine a scenario with a web page containing a pivot table with a table, chart views, and a grid table, all built with Syncfusion components. With a click, you can export the entire data set to a single PDF document. This ensures your insights and visualizations are in a shareable format, making efficient collaboration and communication.
Import { Component, OnInit, ViewChild } from ‘@angular/core’;
import { IdataOptions, IdataSet, PivotView, PDFExportService, DisplayOption } from ‘@syncfusion/ej2-angular-pivotview’;
import { ChartSettings } from ‘@syncfusion/ej2-pivotview/src/pivotview/model/chartsettings’;
import { GridComponent, PdfExportService as GridPdfExportService } from ‘@syncfusion/ej2-angular-grids’;
import { Button } from ‘@syncfusion/ej2-buttons’;
import { pivot_Data, grid_Ddata } from ‘../data’;

@Component({
  selector: ‘app-container’,
  providers: [PDFExportService, GridPdfExportService],
  styleUrls: [‘pivottable-with-grid-exporting.component.css’],
  templateUrl: `<h4>Multiple export</h4>
  <div class="col-md-2"><button ej-button id=’export-btn’>Export</button></div>
  <div class="col-md-8">
      <h2 style="text-align: center;">Pivot Table</h2>
      <ejs-pivotview #pivotview height=’350’ [dataSourceSettings]=dataSourceSettings allowPdfExport=’true’
          (load)=’load()’ width=width [displayOption]=’displayOption’ [chartSettings]=’chartSettings’></ejs-pivotview>
      <h2 style="text-align: center;">Data Grid</h2>
      <ejs-grid #grid [dataSource]=’grid_Data’
          height=’272px’ [allowPdfExport]=’true’>
          <e-columns>
              <e-column field=’OrderID’ headerText=’Order ID’ textAlign=’Right’ width=120></e-column>
              <e-column field=’CustomerID’ headerText=’Customer ID’ width=150></e-column>
              <e-column field=’ShipCity’ headerText=’Ship City’ width=150></e-column>
              <e-column field=’ShipName’ headerText=’Ship Name’ width=150></e-column>
          </e-columns>
      </ejs-grid>
  </div>`
})

export class ExternalTableExportingComponent implements OnInit {
  public grid_Data?: object[];
  public width: string;
  public dataSourceSettings: IdataOptions;
  public displayOption: DisplayOption;
  public chartSettings?: ChartSettings;
  public button: Button;
  public pivotTablePdfExport: Promise<Object>;
  public gridPdfExport: Promise<Object>;
    @ViewChild(‘pivotview’, {static: false})
    public pivotChartObj: PivotView;

    @ViewChild(‘grid’)
    public grid?: GridComponent;

    load() {
      this.pivotChartObj.allowEngineExport = true;
    }

    ngOnInit(): void {
        this.grid_Data = grid_Ddata;
        this.width = “100%”;
        this.dataSourceSettings = {
          dataSource: pivot_Data as IdataSet[],
            expandAll: false,
            columns: [{ name: ‘Year’, caption: ‘Production Year’ }, { name: ‘Quarter’ }],
            values: [{ name: ‘Sold’, caption: ‘Units Sold’ }, { name: ‘Amount’, caption: ‘Sold Amount’ }],
            rows: [{ name: ‘Country’ }, { name: ‘Products’ }],
            formatSettings: [{ name: ‘Amount’, format: ‘C0’ }],

        };
        this.displayOption = { view: ‘Both’ } as DisplayOption;
        this.chartSettings = { title: ‘Overall Product Sales Analysis’, enableMultipleAxis: true, multipleAxisMode : ‘Single’,  hartSeries: { type: ‘Column’ },} as ChartSettings;
        this.button = new Button({ isPrimary: true });
        this.button.appendTo(‘#export-btn’);

        this.button.element.onclick = (): void => {
          // Here, pivot table data is exported as a PDF document and saved as an object in the pivotTablePdfExport variable.
          This.pivotTablePdfExport = this.pivotChartObj.pdfExport({}, true, undefined, false, true);
          this.pivotTablePdfExport.then((pdfData: Object) => {
            // Here, the data grid is exported to the PDF document object “pdfData” which includes pivot table data and is exported as a downloadable file.
            This.grid?.pdfExport({}, false, pdfData) as any;
          });
        };
    }
}
Refer to the following images.
The most exciting aspect is the ability to customize the appearance of your Pivot Table within the exported PDF document. Let’s explore them one by one.
The PDF export feature allows you to modify the page orientation by setting the pageOrientation property within the pdfExportProperties object and passing it as a parameter when invoking the pdfExport method.
By implementing the code outlined above, you can export the Pivot Table to a PDF document in Landscape mode utilizing the pageOrientation property when invoking the pdfExport method.
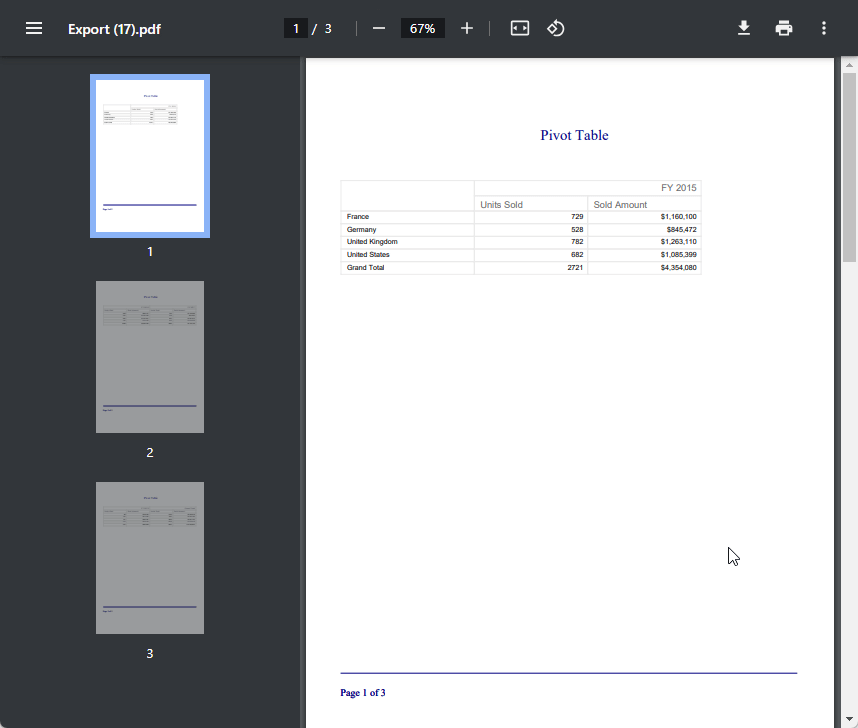
When exporting the Pivot Table to a PDF file, the first step is incorporating a header and footer. These elements allow you to add text, page numbers, lines, page size, and orientation. You can configure this header and footer using the pdfExportProperties parameter, which should be passed to the pdfExport method.
Refer to the following code example. Here, the header displays the text Pivot Table with a defined font size and color, center-aligned within the header area. A border separates the header from the footer section, which displays details of the page size and current page number.
import { Component, OnInit, ViewChild } from '@angular/core';
import { IDataOptions, IDataSet, PivotView, PDFExportService } from '@syncfusion/ej2-angular-pivotview';
import { Button } from '@syncfusion/ej2-buttons';
import { PdfExportProperties } from '@syncfusion/ej2-grids';
import { pivot_Data } from '../data';

@Component({
  selector: 'app-container',
  providers: [PDFExportService],
  template: `<div class="col-md-8">
  <ejs-pivotview #pivotview  height='350' [dataSourceSettings]=dataSourceSettings allowPdfExport='true' width=width></ejs-pivotview></div>
  <div class="col-md-2"><button ej-button id='export'>Export</button></div>`
})

export class AddHeaderAndFooterComponent implements OnInit {
  public width: string;
  public dataSourceSettings: IDataOptions;
  public button: Button;
  public pdfExportProperties: PdfExportProperties;

    @ViewChild('pivotview', {static: false})
    public pivotGridObj: PivotView;

    ngOnInit(): void {
        this.width = "100%";
        this.dataSourceSettings = {
          dataSource: pivot_Data as IDataSet[],
            expandAll: false,
            columns: [{ name: 'Year', caption: 'Production Year' }, { name: 'Quarter' }],
            values: [{ name: 'Sold', caption: 'Units Sold' }, { name: 'Amount', caption: 'Sold Amount' }],
            rows: [{ name: 'Country' }, { name: 'Products' }],
            formatSettings: [{ name: 'Amount', format: 'C0' }],
        };
        this.button = new Button({ isPrimary: true });
        this.button.appendTo('#export');

        this.button.element.onclick = (): void => {
            this.pdfExportProperties = {
                header: {
                    fromTop: 0,
                    height: 130,
                    contents: [
                     {
                            type: 'Text',
                            value: "Pivot Table",
                            position: { x: 300, y: 50 },
                            style: { textBrushColor: '#000080', fontSize: 22, dashStyle:'Solid',hAlign:'Center' }
                      }
                    ]
                },
                footer: {
                    fromBottom: 160,
                    height: 150,
                    contents: [
                        {
                            type: 'Line',
                            style: { penColor: '#000080', penSize: 1, dashStyle: 'Solid' },
                            points: { x1: 0, y1: 4, x2: 685, y2: 4 },
                        },
                        {
                            type: 'PageNumber',
                            pageNumberType: 'Arabic',
                            format: 'Page {$current} of {$total}',
                            position: { x: 0, y: 25 },
                            style: { textBrushColor: '#02007a', fontSize: 15 }
                        }
                    ]
                }
            };
            this.pivotGridObj.pdfExport(this.pdfExportProperties);
        };
    }
}
Refer to the following image.
The export feature offers a variety of page size options such as Letter, Note, Legal, A0, A1, A2, A3, A5, A6, A7, A8, A9, B0, B1, B2, B3, B4, B5, Archa, Archb, Archc, Archd, Arche, Flsa, HalfLetter, Letter11x17, and Ledger. This extensive choice allows you to optimize the layout of your exported Pivot Table data for better presentation. You can overcome challenges like data overflowing onto multiple pages, highlighting key information, or customizing layouts for larger datasets with numerous rows and columns. To change the page size, set the pageSize property within the pdfExportProperties object and pass it as a parameter when using the pdfExport method.
The following code example demonstrates how to export the Pivot Table to a PDF document with size in Letter format using the pageSize property.
import { Component, OnInit, ViewChild } from '@angular/core';
import { IDataOptions, IDataSet, PivotView } from '@syncfusion/ej2-angular-pivotview';
import { Button } from '@syncfusion/ej2-buttons';
import { PdfExportProperties } from '@syncfusion/ej2-grids';
import { pivot_Data } from '../data';
@Component({
selector: 'app-container',
template: `<div class="col-md-8">
<ejs-pivotview #pivotview height='350' [dataSourceSettings]=dataSourceSettings allowPdfExport='true' width=width></ejs-pivotview></div>
<div class="col-md-2"><button ej-button id='export'>Export</button></div>`
})
export class ChangingPageSizeComponent implements OnInit {
public width: string;
public dataSourceSettings: IDataOptions;
public button: Button;
public pdfExportProperties: PdfExportProperties;
@ViewChild('pivotview', { static: false })
public pivotGridObj: PivotView;
ngOnInit(): void {
this.width = "100%";
this.dataSourceSettings = {
dataSource: pivot_Data as IDataSet[],
expandAll: false,
columns: [{ name: 'Year', caption: 'Production Year' }, { name: 'Quarter' }],
values: [{ name: 'Sold', caption: 'Units Sold' }, { name: 'Amount', caption: 'Sold Amount' }],
rows: [{ name: 'Country' }, { name: 'Products' }],
formatSettings: [{ name: 'Amount', format: 'C0' }],
};
this.button = new Button({ isPrimary: true });
this.button.appendTo('#export');
this.button.element.onclick = (): void => {
this.pdfExportProperties = {
pageSize: 'Letter'
};
this.pivotGridObj.pdfExport(this.pdfExportProperties);
};
}
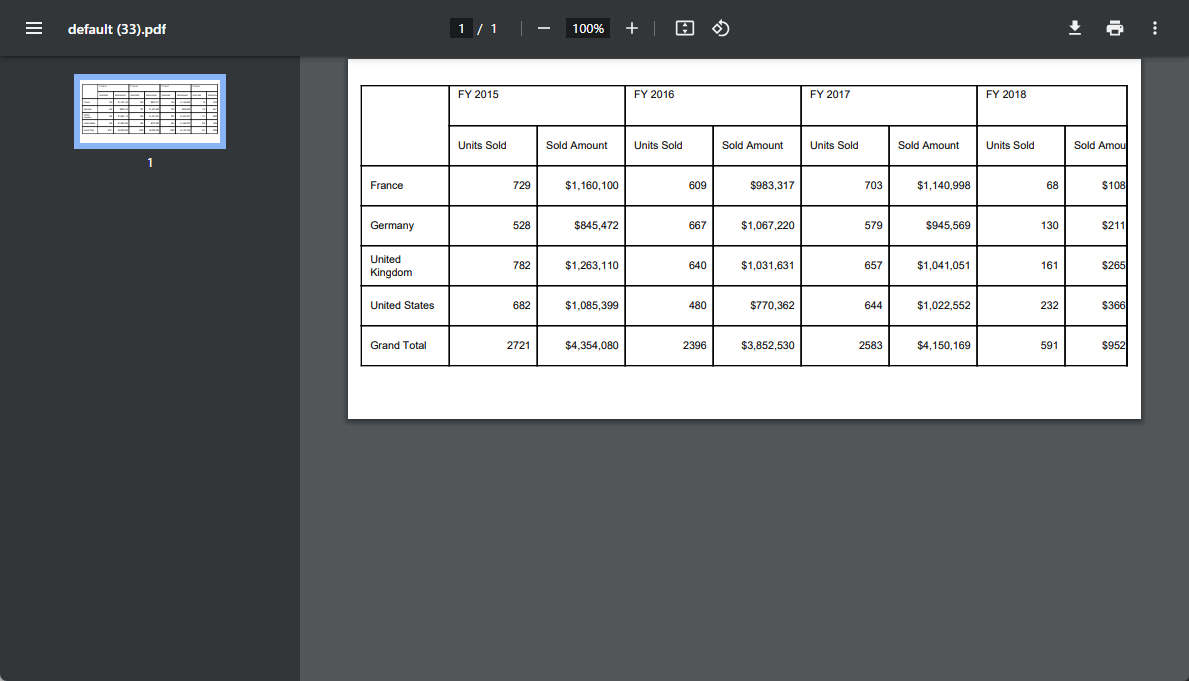
} Beyond pre-defined page sizes, our export feature allows you to set a custom width and height for the PDF document. This unique capability lets you export the pivot table on a single page. You can set the custom width and height for your PDF documents using the height and width properties within the beforeExport event.
Here, we will showcase a Pivot Table exported to a PDF with custom height and width. This is achieved by setting the width property in the beforeExport event with the pivot table’s offset width, as seen in the following code.
import { Component, OnInit, ViewChild } from '@angular/core';
import { IDataOptions, PivotView, VirtualScrollService, PDFExportService, BeforeExportEventArgs, IDataSet  } from '@syncfusion/ej2-angular-pivotview';
import { Button } from '@syncfusion/ej2-buttons';
import { pivot_Data } from '../data';

@Component({
  selector: 'app-container',
  providers: [PDFExportService,VirtualScrollService],
  template: `<div class="col-md-8">
  <ejs-pivotview #pivotview  height='350' [dataSourceSettings]=dataSourceSettings allowPdfExport='true'
  enableVirtualization='true' (beforeExport)='beforeExport($event)' width=width></ejs-pivotview></div>
  <div class="col-md-2"><button ej-button id='export'>Export</button></div>`
})

export class ChangingDocumentWidthAndHeightComponent implements OnInit {
    public width: string;
    public dataSourceSettings: IDataOptions;
    public button: Button;

    @ViewChild('pivotview', {static: false})
    public pivotGridObj: PivotView;

    beforeExport(args: BeforeExportEventArgs) {
        args.width = this.pivotGridObj.element.offsetWidth;
    }
    ngOnInit(): void {
        this.dataSourceSettings = {
          dataSource: pivot_Data as IDataSet[],
            expandAll: true,
            columns: [{ name: 'Year', caption: 'Production Year' }, { name: 'Quarter' }],
            values: [{ name: 'Sold', caption: 'Units Sold' }, { name: 'Amount', caption: 'Sold Amount' }],
            rows: [{ name: 'Country' }, { name: 'Products' }],
            formatSettings: [{ name: 'Amount', format: 'C0' }],
            filters: []
        };
        this.width = '100%';

        this.button = new Button({ isPrimary: true });
        this.button.appendTo('#export');

        this.button.element.onclick = (): void => {
            this.pivotGridObj.pdfExport();
        };
    }
}
Refer to the following image.
The Syncfusion Angular Pivot Table has the flexibility to customize each table cell in terms of size and style when exporting.
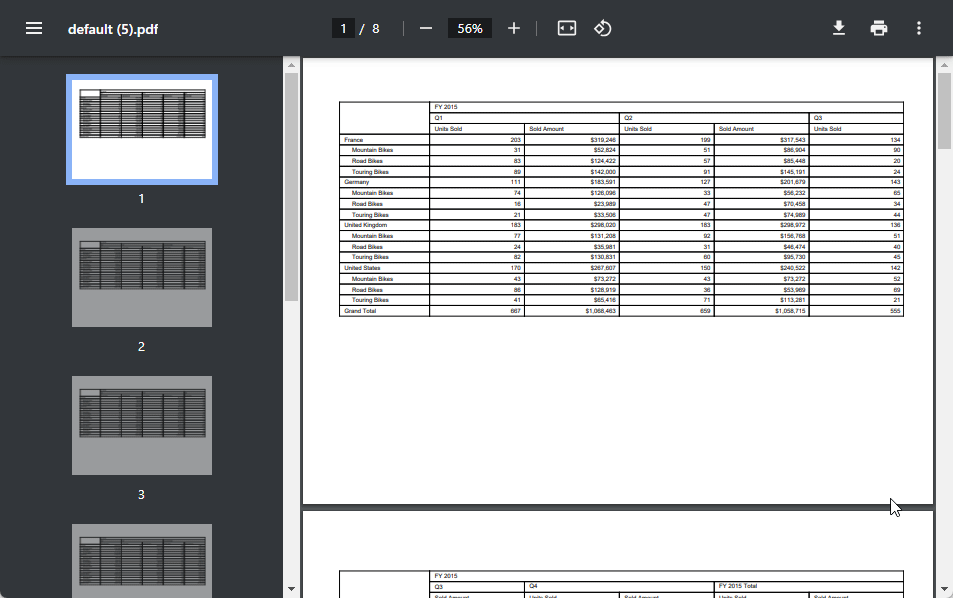
The Angular Pivot Table allows you to split and export its columns onto separate pages in your PDF document using the columnSize property within the beforeExport event. This feature also allows for customizing the presentation of the Pivot Table data, making it an indispensable tool for those seeking to craft organized and tailored PDF reports from pivot tables.
Refer to the following code example. The Pivot Table is exported to PDF, displaying a subset of six columns on each page.
import { Component, OnInit, ViewChild } from '@angular/core';
import { IDataOptions, PivotView, VirtualScrollService, PDFExportService, BeforeExportEventArgs, IDataSet  } from '@syncfusion/ej2-angular-pivotview';
import { Button } from '@syncfusion/ej2-buttons';
import { pivot_Data } from '../data';

@Component({
  selector: 'app-container',
  providers: [PDFExportService,VirtualScrollService],
  template: `<div class="col-md-8">
  <ejs-pivotview #pivotview  height='350' [dataSourceSettings]=dataSourceSettings allowPdfExport='true'
  enableVirtualization='true' (beforeExport)='beforeExport($event)' width=width></ejs-pivotview></div>
  <div class="col-md-2"><button ej-button id='export'>Export</button></div>`
})

export class CustomizeColumnCountComponent implements OnInit {
    public width: string;
    public dataSourceSettings: IDataOptions;
    public button: Button;

    @ViewChild('pivotview', {static: false})
    public pivotGridObj: PivotView;

    beforeExport(args: BeforeExportEventArgs) {
        args.columnSize = 6;
    }

    ngOnInit(): void {
        this.dataSourceSettings = {
          dataSource: pivot_Data as IDataSet[],
            expandAll: true,
            columns: [{ name: 'Year', caption: 'Production Year' }, { name: 'Quarter' }],
            rows: [{ name: 'Country' }, { name: 'Products' }],
            values: [{ name: 'Sold', caption: 'Units Sold' }, { name: 'Amount', caption: 'Sold Amount' }],
            formatSettings: [{ name: 'Amount', format: 'C0' }],
            filters: []
        };
        this.width = '100%';

        this.button = new Button({ isPrimary: true });
        this.button.appendTo('#export');

        this.button.element.onclick = (): void => {
            this.pivotGridObj.pdfExport();
        };
    }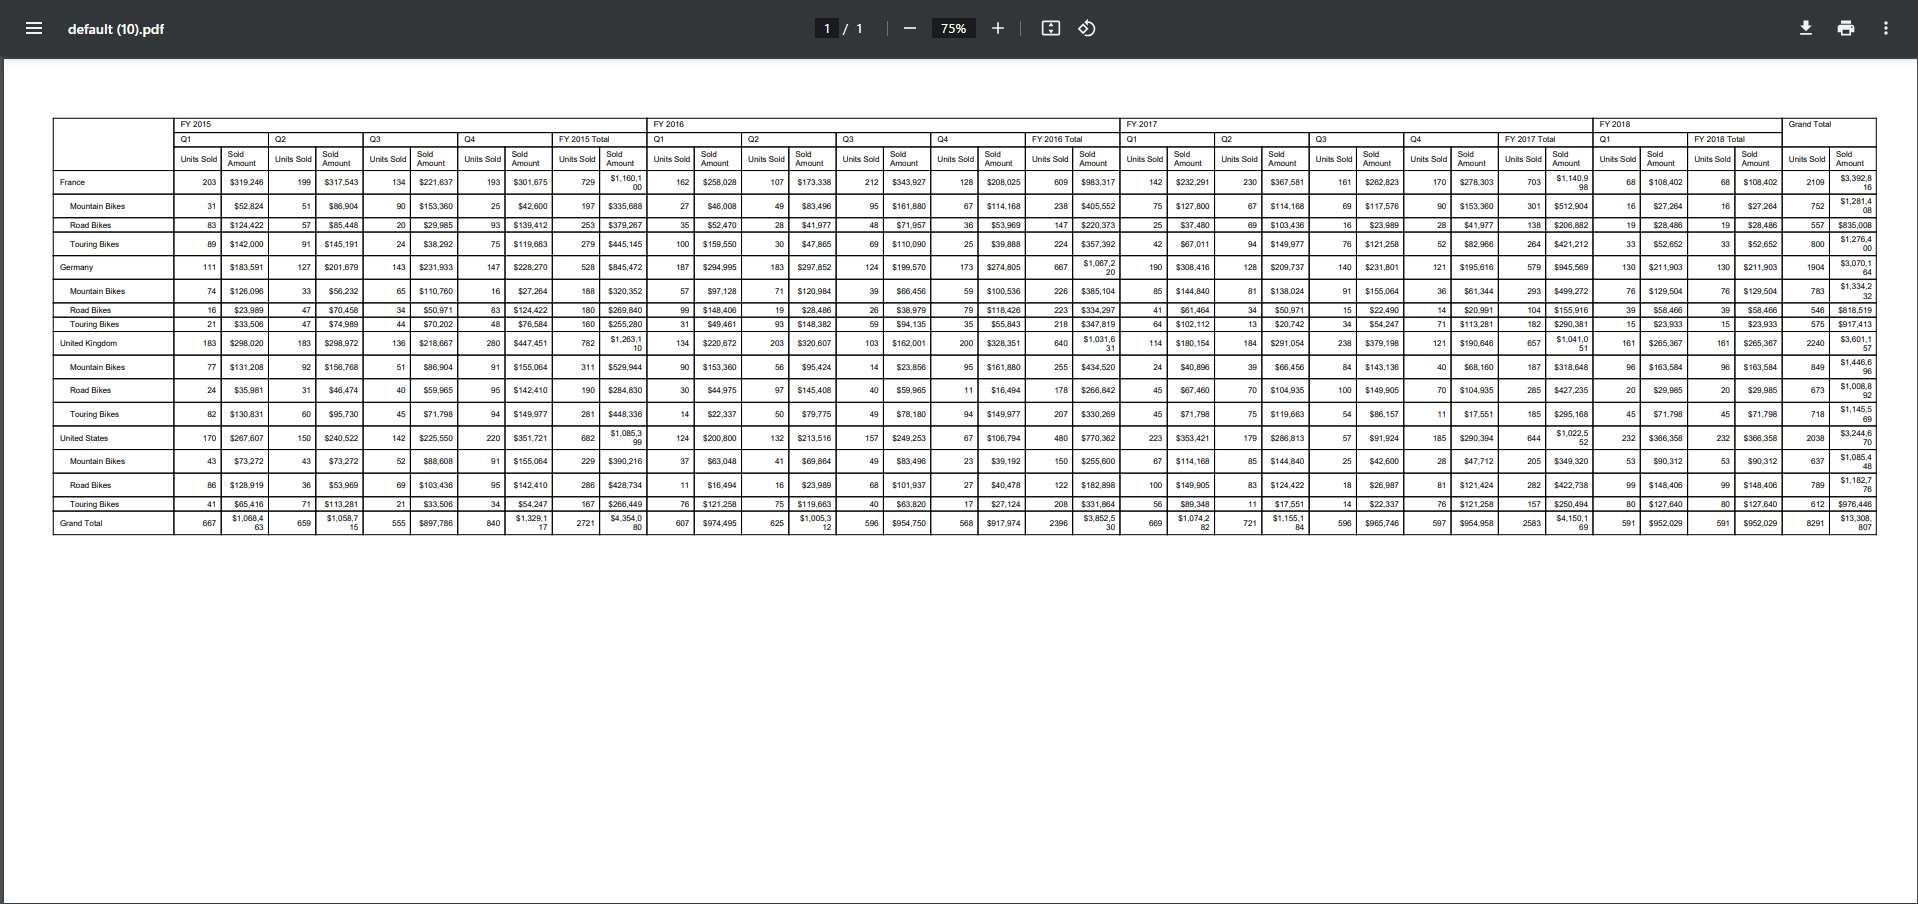
} When exporting the Pivot Table to a PDF document, you can customize the column width and row height dynamically using the onPdfCellRender event. In this event, you can adjust the width and height of individual columns using the column.width and cell.height properties.
In the following code example, we achieve PDF exporting by dynamically adjusting the document height to match the size of the Pivot Table during the beforeExport event. We used the pivot table’s gridSettings options in the onPdfCellRender event to fine-tune the table’s column width and row height.
import { Component, OnInit, ViewChild } from '@angular/core';
import { IDataOptions, PivotView, VirtualScrollService, PDFExportService, BeforeExportEventArgs, IDataSet  } from '@syncfusion/ej2-angular-pivotview';
import { Button } from '@syncfusion/ej2-buttons';
import { pivot_Data } from '../data';

@Component({
  selector: 'app-container',
  providers: [PDFExportService,VirtualScrollService],
  template: `<div class="col-md-8">
  <ejs-pivotview #pivotview  height='350' [dataSourceSettings]=dataSourceSettings allowPdfExport='true'
  enableVirtualization='false' (beforeExport)='beforeExport($event)' (onPdfCellRender)='onPdfCellRender($event)' width=width></ejs-pivotview></div>
  <div class="col-md-2"><button ej-button id='export'>Export</button></div>`
})

export class ChangingTableColumnWidthAndRowHeightComponent implements OnInit {
    public width: string;
    public dataSourceSettings: IDataOptions;
    public button: Button;

    @ViewChild('pivotview', {static: false})
    public pivotGridObj: PivotView;

    beforeExport(args: BeforeExportEventArgs) {
        // Here, the document height calculated by considering the height of the table content + column header height + top and bottom default margin.
        args.height = (document.querySelector('#PivotView_grid_content_table') as HTMLElement).offsetHeight + 60 + 60;
        args.pdfMargins = { left: 0, right: 10, top: 0, bottom: 0 };
    }

    onPdfCellRender(args: any) {
      // The width of the pivot table row header can be changed here.
      if (args.pivotCell && args.pivotCell.axis == 'row') {
         args.column.width = (this.pivotGridObj.gridSettings.columnWidth as number) * 0.5;
        }
      // The width of the pivot table column can be changed here.
      args.column.width =  (this.pivotGridObj.gridSettings.columnWidth as number) * 0.6;
        // The height of the pivot table row can be changed here.
        args.cell.height = this.pivotGridObj.gridSettings.rowHeight;
    }

    ngOnInit(): void {
        this.dataSourceSettings = {
          dataSource: pivot_Data as IDataSet[],
            expandAll: false,
            columns: [{ name: 'Year', caption: 'Production Year' }, { name: 'Quarter' }],
            values: [{ name: 'Sold', caption: 'Units Sold' }, { name: 'Amount', caption: 'Sold Amount' }],
            rows: [{ name: 'Country' }, { name: 'Products' }],
            formatSettings: [{ name: 'Amount', format: 'C0' }],
            filters: []
        };
        this.width = '100%';

        this.button = new Button({ isPrimary: true });
        this.button.appendTo('#export');

        this.button.element.onclick = (): void => {
            this.pivotGridObj.pdfExport();
        };
    }
}
Refer to the following image.
The Angular Pivot Table will be exported with the Helvetica font by default. However, you can customize this using the theme property within the pdfExportProperties parameter passed to the pdfExport method. You can choose from a collection of built-in fonts, such as Helvetica, TimesRoman, Courier, Symbol, and ZapfDingbats. Moreover, you can extend your options beyond these built-in fonts by incorporating custom fonts. You can even encode a custom font in Base64 format and define it within the PdfTrueTypeFont class.
Refer to the following code example. Here, we will export the PDF document with a custom font style. We used the TimesRomanfont family for column headers and a custom font family, Advent Pro (supporting the Hungarian language), for the row content. Additionally, I have applied background and font colors through conditional styling using the onPdfCellRender, pdfQueryCellInfo, and pdfHeaderQueryCellInfo events to set style properties for both table headers and values.
import { Component, OnInit, ViewChild } from '@angular/core';
import { IDataOptions, IDataSet, PdfCellRenderArgs, PivotView, VirtualScrollService, PDFExportService, IAxisSet, BeforeExportEventArgs } from '@syncfusion/ej2-angular-pivotview';
import { GridSettings } from '@syncfusion/ej2-pivotview/src/pivotview/model/gridsettings';
import { Button } from '@syncfusion/ej2-buttons';
import { PdfExportProperties } from '@syncfusion/ej2-grids';
import {  PdfTrueTypeFont, PdfStandardFont,  PdfFontFamily,  PdfFontStyle } from '@syncfusion/ej2-pdf-export';
import { pivot_Data, base64AlgeriaFont } from '../data';
import { Observable } from 'rxjs';

@Component({
  selector: 'app-container',
  providers: [PDFExportService,VirtualScrollService],
  template: `<div class="col-md-8">
  <ejs-pivotview #pivotview height='350' [dataSourceSettings]=dataSourceSettings allowPdfExport='true' width=width enableVirtualization='true'
  [gridSettings]='gridSettings' (onPdfCellRender)='onPdfCellRender($event)' (beforeExport)='beforeExport($event)'></ejs-pivotview></div>
  <div class="col-md-2"><button ej-button id='export'>Export</button></div>`
})

export class AddingCustomFontComponent implements OnInit {
  public width: string;
  public dataSourceSettings: IDataOptions;
  public gridSettings?: GridSettings;
  public button: Button;
  public pdfExportProperties: PdfExportProperties;
  public observable = new Observable();
    @ViewChild('pivotview', {static: false})
    public pivotGridObj: PivotView;

    onPdfCellRender(args: any) {
      if ((args.pivotCell as IAxisSet).axis === 'value' && (args.pivotCell as IAxisSet).isGrandSum !== true) {
        args.style = { textBrushColor: '#000000' };
      }
      // The width of the pivot table row header can be changed here.
      if (args.pivotCell && args.pivotCell.axis == 'row') {
        args.column.width = (this.pivotGridObj.gridSettings.columnWidth as number) * 0.5;
      }
      // The width of the pivot table column can be changed here.
      args.column.width =  (this.pivotGridObj.gridSettings.columnWidth as number) * 0.6;
      // The height of the pivot table row can be changed here.
      args.cell.height = this.pivotGridObj.gridSettings.rowHeight;
    }
    beforeExport(args: BeforeExportEventArgs) {
      args.width = 900;
    }

    ngOnInit(): void {
        this.width = "100%";
        this.dataSourceSettings = {
          dataSource: pivot_Data as IDataSet[],
            columns: [{ name: 'Year', caption: 'Production Year' }],
            values: [{ name: 'Sold', caption: 'Units Sold' }, { name: 'Amount', caption: 'Sold Amount' }],
            rows: [{ name: 'Country' }, { name: 'Products' }],
            formatSettings: [{ name: 'Amount', format: 'C0' }],
            filters: [],
        };

        this.gridSettings = {
          pdfQueryCellInfo: this.observable.subscribe((args: any) => {
            if ((args.data as IAxisSet).axis === 'row') {
              if ((args.data as IAxisSet).type === 'grand sum') {
                args.style = { backgroundColor: '#e8e2d2' };
              } else {
                args.style = { backgroundColor: '#e8e2d2' };
              }
            } else if ((args.data as IAxisSet).axis === 'value' && (args.data as IAxisSet).isGrandSum == true) {
                args.style = { backgroundColor: '#e8e2d2' };
            }
        }) as any,
        pdfHeaderQueryCellInfo: this.observable.subscribe((args: any) => {
          if ((args.gridCell as IAxisSet).axis === 'column') {
            if ((args.gridCell as IAxisSet).type === 'grand sum') {
              args.style = { backgroundColor: '#e8f4d2' };
            } else {
              args.style = { backgroundColor: '#e8e2d2' };
            }
          }
      }) as any
        } as GridSettings;
        this.button = new Button({ isPrimary: true });
        this.button.appendTo('#export');

        this.button.element.onclick = (): void => {
            this.pdfExportProperties = {
               theme: {
                header: {
                  font: new PdfStandardFont(
                    PdfFontFamily.TimesRoman,
                    11,
                    PdfFontStyle.Bold
                  ),
                  fontColor: '#000080',
                  bold: true,
                  border: { color: '#5A5A5A', dashStyle: 'Solid' },
                },
                caption: {
                  font: new PdfTrueTypeFont(base64AlgeriaFont, 9),
                  fontColor: '#0B6623',
                  bold: true, },
                record: {
                  font: new PdfTrueTypeFont(base64AlgeriaFont, 10),
                  fontColor: '#B22222',
                  bold: true, },
                },
                header: {
                  fromTop: 0,
                  height: 300,
                  contents: [
                      {
                          type: 'Text',
                          value: "Product Sales Report",
                          position: { x: 300, y: 0 },
                          size: { width: 100, height: 100 },
                          style: { textBrushColor: '#000080', fontSize: 32, dashStyle:'Solid', hAlign:'Center' }
                      }
                  ]
                },
                footer: {
                    fromBottom: 160,
                    height: 150,
                    contents: [
                        {
                            type: 'Line',
                            style: { textBrushColor: '#000080', penSize: 1, dashStyle: 'Solid' },
                            points: { x1: 0, y1: 4, x2: 685, y2: 4 }
                        },
                        {
                            type: 'PageNumber',
                            pageNumberType: 'Arabic',
                            format: 'Page {$current} of {$total}',
                            position: { x: 0, y: 25 },
                            style: { textBrushColor: '#02007a', fontSize: 15 }
                        }
                    ]
                }
            };
            this.pivotGridObj.pdfExport(this.pdfExportProperties);
        };
    }
}
Refer to the following image.
The Angular Pivot Table offers the following additional PDF export options:
Ready to explore? Dive deeper into these PDF exporting functionalities within our official documentation. Elevate your data export capabilities with Syncfusion Angular Pivot Table!
For more details, refer to Export Angular Pivot Table to PDF with advanced customization demo on GitHub.
Thanks for reading! The Angular Pivot Table streamlines exporting your data into PDF documents. You can customize your exports, combine multiple pivot tables, and even include charts in your PDFs. These features are essential for creating clear and informative reports.
If you’re an existing Syncfusion user, download the latest version of Essential Studio® from the License and Downloads page. If you’re new to Syncfusion, you can use our 30-day free trial to explore the features and capabilities of our components.
If you have questions, you can reach us through our support forum, support portal, or feedback portal. We are always happy to assist you!