TL;DR: Discover how to create dynamic charts using Syncfusion® .NET MAUI Toolkit effortlessly. Transform JSON input into professional-quality visuals easily, saving time and enhancing productivity. Explore step-by-step setup, benefits, and future AI integration for seamless chart creation.
Creating visually stunning and functional chart UIs can be time-consuming. This blog introduces an innovative approach for auto-generating charts using Syncfusion® .NET MAUI Toolkit. With just a JSON input, you can dynamically create, bind, and display charts and even export them to formats like PDF or PowerPoint.
Let’s explore how this application saves time, enhances productivity, and simplifies chart-building.
Why auto-generated charts?
Creating a professional chart UI often involves significant design and coding effort. However, the app we will develop offers:
- Ease of use: Developers and users can focus on their data instead of spending hours on UI design.
- Time-saving: Charts are generated dynamically from JSON input, minimizing manual effort.
- Flexibility: The app supports multiple chart types and effortlessly adapts to different data structures.
With these features, this app is a game-changer for anyone looking to quickly visualize data without compromising quality.
Overview of the application
The chart generator app includes:
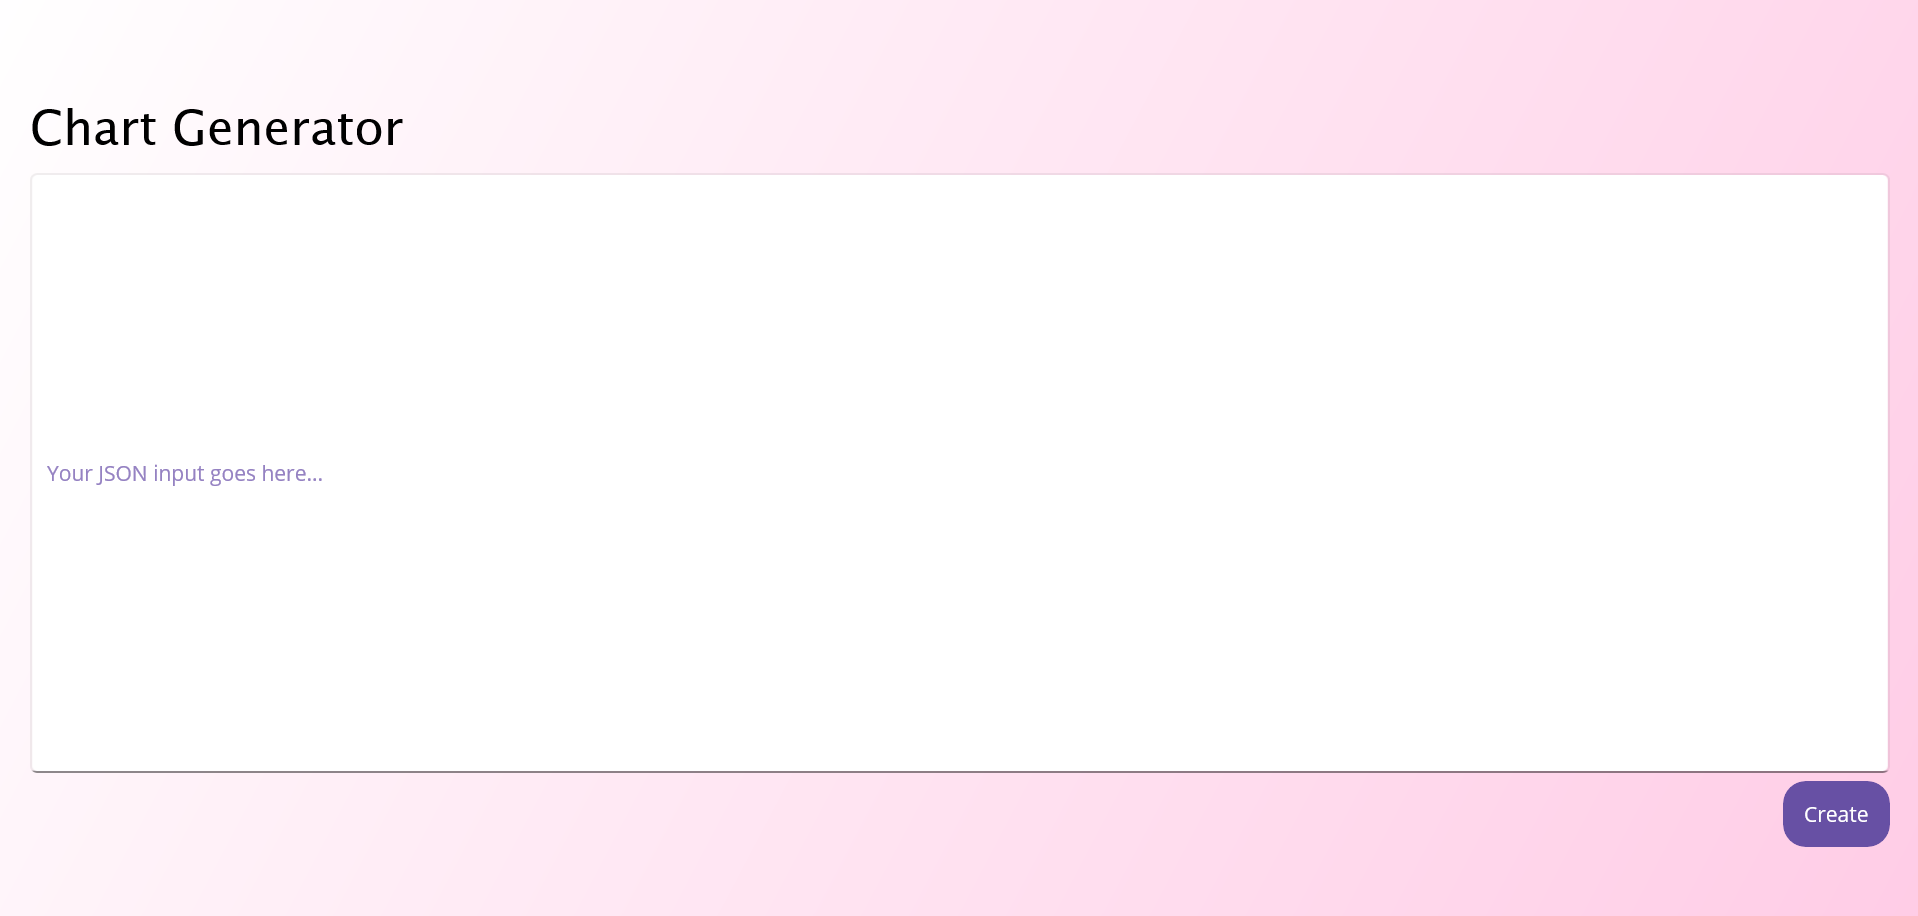
- A TextBox for user-provided JSON input.
- A Button to trigger the chart generation process.
- Syncfusion® Charts (SfCartesianChart and SfCircularChart) for data visualization.
How it works?
- The user needs to enter the JSON into the TextBox.
- The app converts the JSON into a class structure.
- The class is then dynamically bound to the chart.
- The appropriate chart type (Cartesian or Circular) is displayed based on the data type.
Setting up the project
Adding the .NET MAUI Toolkit to the project
To simplify the development process, we’ll use the Syncfusion.Maui.Toolkit package. This toolkit provides a wide range of utilities, controls, and helpers to enhance the capabilities of .NET MAUI apps. It’s designed to save time and effort by offering ready-to-use features, including chart components.
Install the package using the following command:
dotnet add package Syncfusion.Maui.Toolkit
Creating the user interface
Define a simple and intuitive UI on your XAML page using the following code example.
<VerticalStackLayout Spacing="5" Grid.Column="0"
      Margin="0,20,0,0"
      VerticalOptions="FillAndExpand"
      HorizontalOptions="FillAndExpand">
    <Label Text="Chart Generator"
                       FontSize="32" Grid.Row="0"
                       HorizontalOptions="Start"
                       FontFamily="Lucida Sans Unicode"/>

    <Editor AutoSize="TextChanges"
                        x:Name="entry"
                        MinimumHeightRequest="100"
                        HeightRequest="400"
                        MaximumHeightRequest="600"
                        Grid.Row="1"
                        Background="White"
                        PlaceholderColor="#9582C2"
                        VerticalOptions="Fill"
                        HorizontalOptions="FillAndExpand"
                        VerticalTextAlignment="Center"
                        Text="{Binding EntryText}"
                        Placeholder="Your JSON input goes here..."/>

    <Button x:Name="createButton"
                        IsEnabled="True"
                        Grid.Row="2"
                        CornerRadius="15"
                        Text="Create"
                        VerticalOptions="Center"
                        HorizontalOptions="End"
                        Background="#6750A4"
                        Command="{Binding CreateButtonClicked}"/>
</VerticalStackLayout>
Now, define a view model for the above UI.
public class ChartViewModel : INotifyPropertyChanged
{
    public event PropertyChangedEventHandler? PropertyChanged;

    private string? entryText;
    private ContentView? chart;

    public string? EntryText
    {
        get => entryText;
        set
        {
            entryText = value;
            OnPropertyChanged(nameof(EntryText));
        }
    }

    public ContentView? Chart
    {
        get => chart;
        set
        {
            chart = value;
            OnPropertyChanged(nameof(Chart));
        }
    }

    public ChartConfig ChartData
    {
        get => chartData;
        set
        {
            chartData = value;
            OnPropertyChanged(nameof(ChartData));
        }
    }

    public ICommand ButtonClicked { get; }
    public ICommand CreateButtonClicked { get; }

    public ChartViewModel()
    {
        ButtonClicked = new Command<string>(OnButtonClicked);
        CreateButtonClicked = new Command(OnCreateButtonClicked);
    }

    private void OnButtonClicked(string buttonText)
    {
        EntryText = ReturnOfflineEditorText(buttonText);
    }

    private async void OnCreateButtonClicked()
    {
        //Descript JSON goes here.
    }

    internal string ReturnOfflineEditorText(string entryText)
    {
        string response = string.Empty;

        if (entryText.Contains("line"))
        {
            return response // Modify response with dummy predefined JSON
        }

        return response;
    }
}
Refer to the following image.

Now, define a class to deserialize the data from JSON.
public class ChartConfig : INotifyPropertyChanged
{
    private ChartEnums.ChartTypeEnum chartType;
    private string title;
    private Axes xAxis;
    private Axes yAxis;
    private ObservableCollection<SeriesConfig> series;

    public ChartEnums.ChartTypeEnum ChartType
    {
        get => chartType;
        set
        {
            if (chartType != value)
            {
                chartType = value;
                OnPropertyChanged();
            }
        }
    }

    public string Title
    {
        get => title;
        set
        {
            if (title != value)
            {
                title = value;
                OnPropertyChanged();
            }
        }
    }

    public Axes XAxis
    {
        get => xAxis;
        set
        {
            if (xAxis != value)
            {
                xAxis = value;
                OnPropertyChanged();
            }
        }
    }

    public Axes YAxis
    {
        get => yAxis;
        set
        {
            if (yAxis != value)
            {
                yAxis = value;
                OnPropertyChanged();
            }
        }
    }

    public ObservableCollection<SeriesConfig> Series
    {
        get => series;
        set
        {
            if (series != value)
            {
                series = value;
                OnPropertyChanged();
            }
        }
    }

    public event PropertyChangedEventHandler PropertyChanged;
    protected void OnPropertyChanged([CallerMemberName] string propertyName = null)
    {
        PropertyChanged?.Invoke(this, new PropertyChangedEventArgs(propertyName));
    }
}

public class Axes : INotifyPropertyChanged
{
    private string? title;
    private double? min;
    private double? max;

    public string? Title
    {
        get => title;
        set
        {
            if (title != value)
            {
                title = value;
                OnPropertyChanged();
            }
        }
    }

    public ChartEnums.AxisType Type
    {
        get;
        set;
    }

    public double? Min
    {
        get => min;
        set
        {
            if (min != value)
            {
                min = value;
                OnPropertyChanged();
            }
        }
    }

    public double? Max
    {
        get => max;
        set
        {
            if (max != value)
            {
                max = value;
                OnPropertyChanged();
            }
        }
    }

    public event PropertyChangedEventHandler? PropertyChanged;

    protected virtual void OnPropertyChanged([CallerMemberName] string propertyName = null)
    {
        PropertyChanged?.Invoke(this, new PropertyChangedEventArgs(propertyName));
    }
}
Let’s define a class for series deserialization. Refer to the following code example.
public class SeriesConfig
{
    public ChartEnums.SeriesType Type
    {
        get; set;
    }

    public string XPath
    {
        get; set;
    }

    public ObservableCollection<DataModel> DataSource
    {
        get; set;
    }

    public bool Tooltip
    {
        get; set;
    }
}

public class DataModel
{
    public string xvalue
    {
        get; set;
    }

    public double yvalue
    {
        get; set;
    }

    public DateTime? date
    {
        get; set;
    }

    public double? xval
    {
        get; set;
    }
}
Refer to the following code example to predefine series templates.
<DataTemplate x:Key="lineSeriesTemplate">
    <chart:LineSeries ItemsSource="{Binding DataSource}"
                      XBindingPath="xvalue"
                      YBindingPath="yvalue"
                      EnableTooltip="{Binding Tooltip}"
                      Label="{Binding Type}"
                      StrokeWidth="2.5"
                      ShowMarkers="True"
                      Fill="#1E90FF"
                      EnableAnimation="True">
        <chart:LineSeries.MarkerSettings>
            <chart:ChartMarkerSettings Fill="SkyBlue"
                                       Stroke="RoyalBlue"
                                       StrokeWidth="2" />
        </chart:LineSeries.MarkerSettings>
    </chart:LineSeries>
</DataTemplate>
. . .
<DataTemplate x:Key="pieSeriesTemplate">
    <chart:PieSeries ItemsSource="{Binding DataSource}"
                     XBindingPath="xvalue"
                     YBindingPath="yvalue"
                     EnableTooltip="{Binding Tooltip}"
                     PaletteBrushes="{StaticResource PaletteBrushesCollection}"
                     EnableAnimation="True">
    </chart:PieSeries>
</DataTemplate>
. . .
<DataTemplate x:Key="areaSeriesTemplate">
    <chart:AreaSeries ItemsSource="{Binding DataSource}"
                      XBindingPath="xvalue"
                      YBindingPath="yvalue"
                      Opacity=".8"
                      Label="{Binding Type}"
                      EnableTooltip="{Binding Tooltip}"
                      EnableAnimation="True">
        <chart:AreaSeries.Fill>
            <LinearGradientBrush StartPoint="0,0" EndPoint="1,0">
                <GradientStop Color="#7FCEC5" Offset="0.0" />
                <GradientStop Color="LightSeaGreen" Offset="1.0" />
            </LinearGradientBrush>
        </chart:AreaSeries.Fill>
    </chart:AreaSeries>
</DataTemplate>
. . .
Now, extend the Cartesian Chart and perform binding with the deserialized class. Refer to the following code example.
public partial class CartesianChartExt : SfCartesianChart
{
    public CartesianChartExt()
    {
        InitializeComponent();
    }

    public static readonly BindableProperty SourceProperty = BindableProperty.Create(nameof(Source), typeof(ObservableCollection<SeriesConfig>), typeof(CartesianChartExt), null, BindingMode.Default, null, OnPropertyChanged);
    public ObservableCollection<SeriesConfig> Source
    {
        get => (ObservableCollection<SeriesConfig>)GetValue(SourceProperty);
        set => SetValue(SourceProperty, value);
    }

    private static void OnPropertyChanged(BindableObject bindable, object oldValue, object newValue)
    {
        if (Equals(oldValue, newValue))
        {
            return;
        }

        if (bindable is CartesianChartExt chart)
        {
            chart.GenerateSeries(newValue as ObservableCollection<SeriesConfig>);
        }
    }

    private void GenerateSeries(ObservableCollection<SeriesConfig> configs)
    {
        if (configs != null)
        {
            this.Series.Clear();
            foreach (var config in configs)
            {
                //CreateSeries(config);
                CreateSeriesFromTemplate(config);
            }
        }
    }

    private void CreateSeriesFromTemplate(SeriesConfig seriesConfig)
    {
        var templateSelector = (SeriesTemplateSelector)Resources["seriesTemplateSelector"];
        var template = templateSelector.SelectTemplate(seriesConfig, null);

        if (template != null)
        {
            ChartSeries series = (ChartSeries)template.CreateContent();

            if (series != null)
            {
                series.BindingContext = seriesConfig;
                this.Series.Add(series);
            }
        }
    }

    private void CreateSeries(SeriesConfig config)
    {
        ChartSeries series = null;

        switch (config.Type)
        {
            case ChartEnums.SeriesType.Line:
                series = new LineSeries
                {
                    ItemsSource = config.DataSource,
                    XBindingPath = config.XPath,
                    YBindingPath = "yvalue",
                    EnableTooltip = config.Tooltip
                };
                break;

            case ChartEnums.SeriesType.Area:
                series = new AreaSeries
                {
                    ItemsSource = config.DataSource,
                    XBindingPath = config.XPath,
                    YBindingPath = "yvalue",
                    EnableTooltip = config.Tooltip
                };
                break;

            case ChartEnums.SeriesType.Spline:
                series = new SplineSeries
                {
                    ItemsSource = config.DataSource,
                    XBindingPath = config.XPath,
                    YBindingPath = "yvalue",
                    EnableTooltip = config.Tooltip
                };
                break;

            case ChartEnums.SeriesType.Column:
                series = new ColumnSeries
                {
                    ItemsSource = config.DataSource,
                    XBindingPath = config.XPath,
                    YBindingPath = "yvalue",
                    EnableTooltip = config.Tooltip
                };
                break;
        }

        if (series != null)
        {
            this.Series.Add(series);
        }
    }
}
Similarly, you can find the .NET MAUI Circular Chart configuration here.
Deserialize JSON to a class
Now, use the System.Text.Json package to parse the JSON input into a structured class.
internal void DecryptJSON(string jsonData)
 {
     try
     {
         var chartData = JsonConvert.DeserializeObject<ChartConfig>(jsonData);

         ChartData = chartData!;
     }
     catch (JsonException ex)
     {
         EntryText = "Invalid JSON, Try Again";
     }
 }
. . .
private async void OnCreateButtonClicked()
{
    if (!string.IsNullOrEmpty(EntryText))
    {
        DecryptJSON(EntryText);

        Application.Current.MainPage.Navigation.PushAsync(new ChartView(this));
    }
    else
    {
        EntryText = "Invalid JSON, Try Again";
    }
}
Here’s an example of the JSON input we use in the app.
{
  "chartType": "circular",
  "title": "Monthly Sales Data",
  "series": [
    {
      "type": "pie",
      "xpath": "category",
      "dataSource": [
        { "xvalue": "January", "yvalue": 5000 },
        { "xvalue": "February", "yvalue": 6000 },
        { "xvalue": "March", "yvalue": 7000 },
      ],
    }
  ]
}
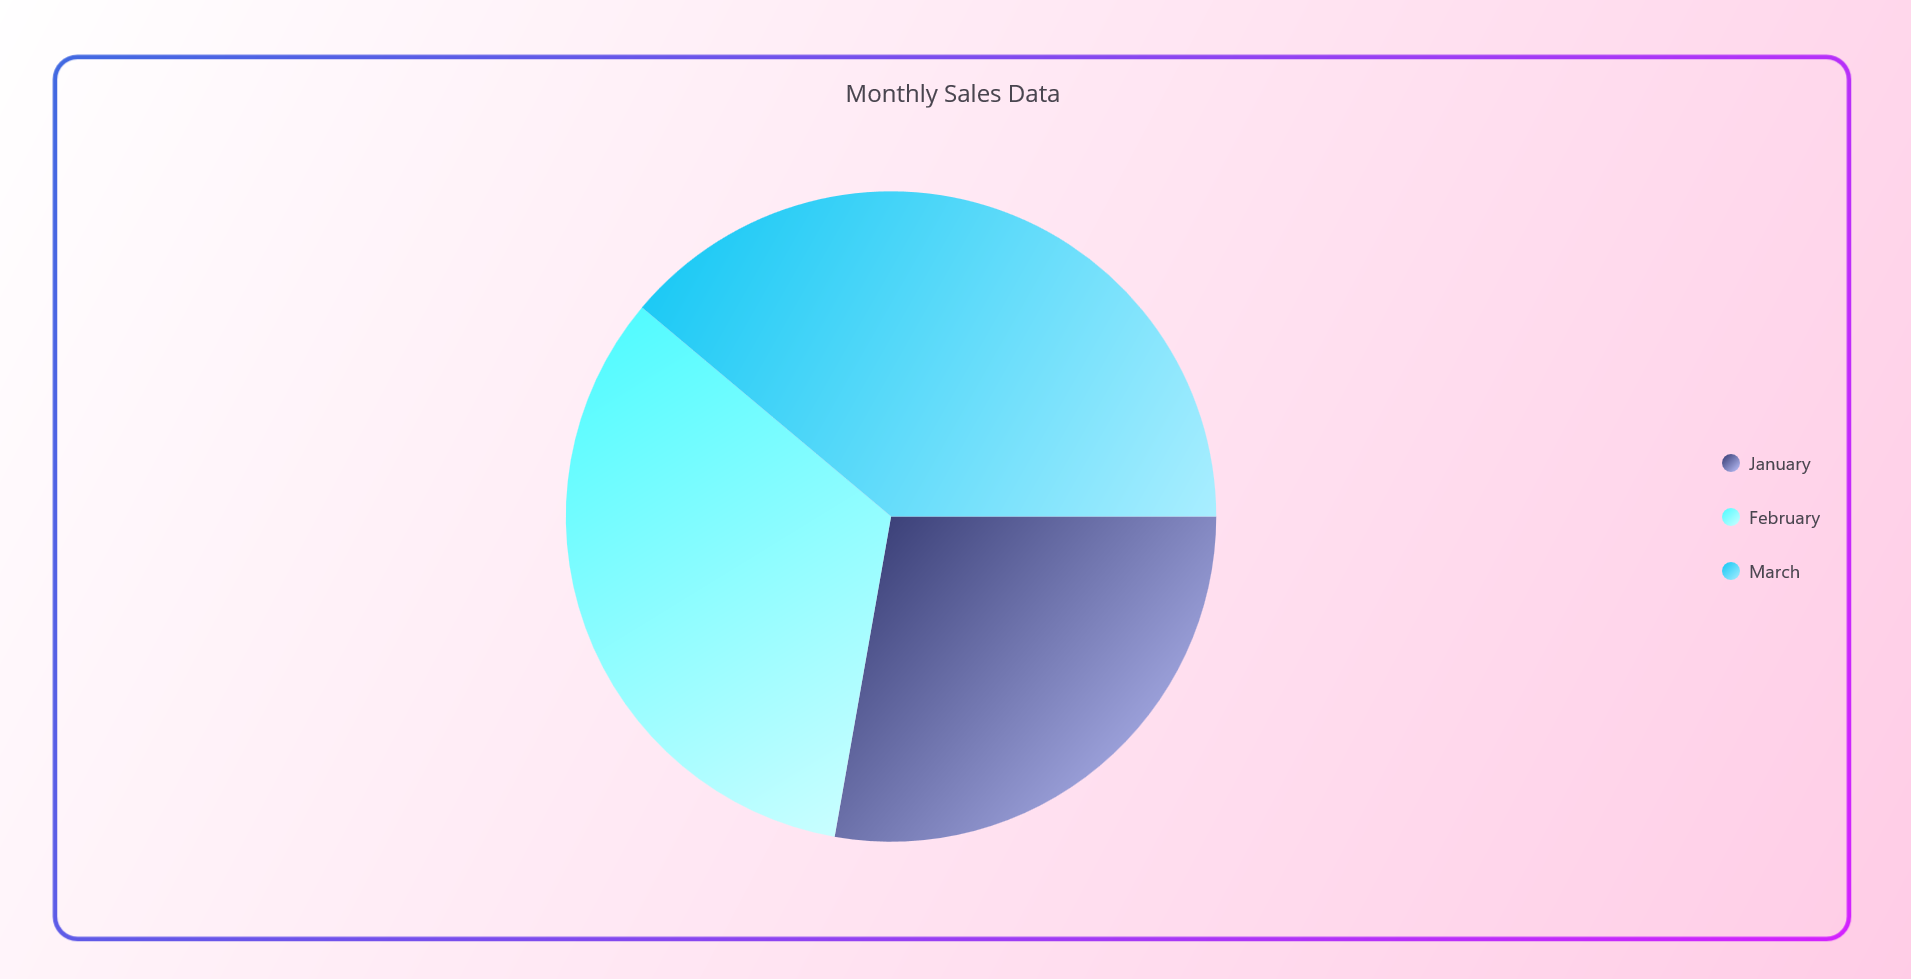
Refer to the following image.

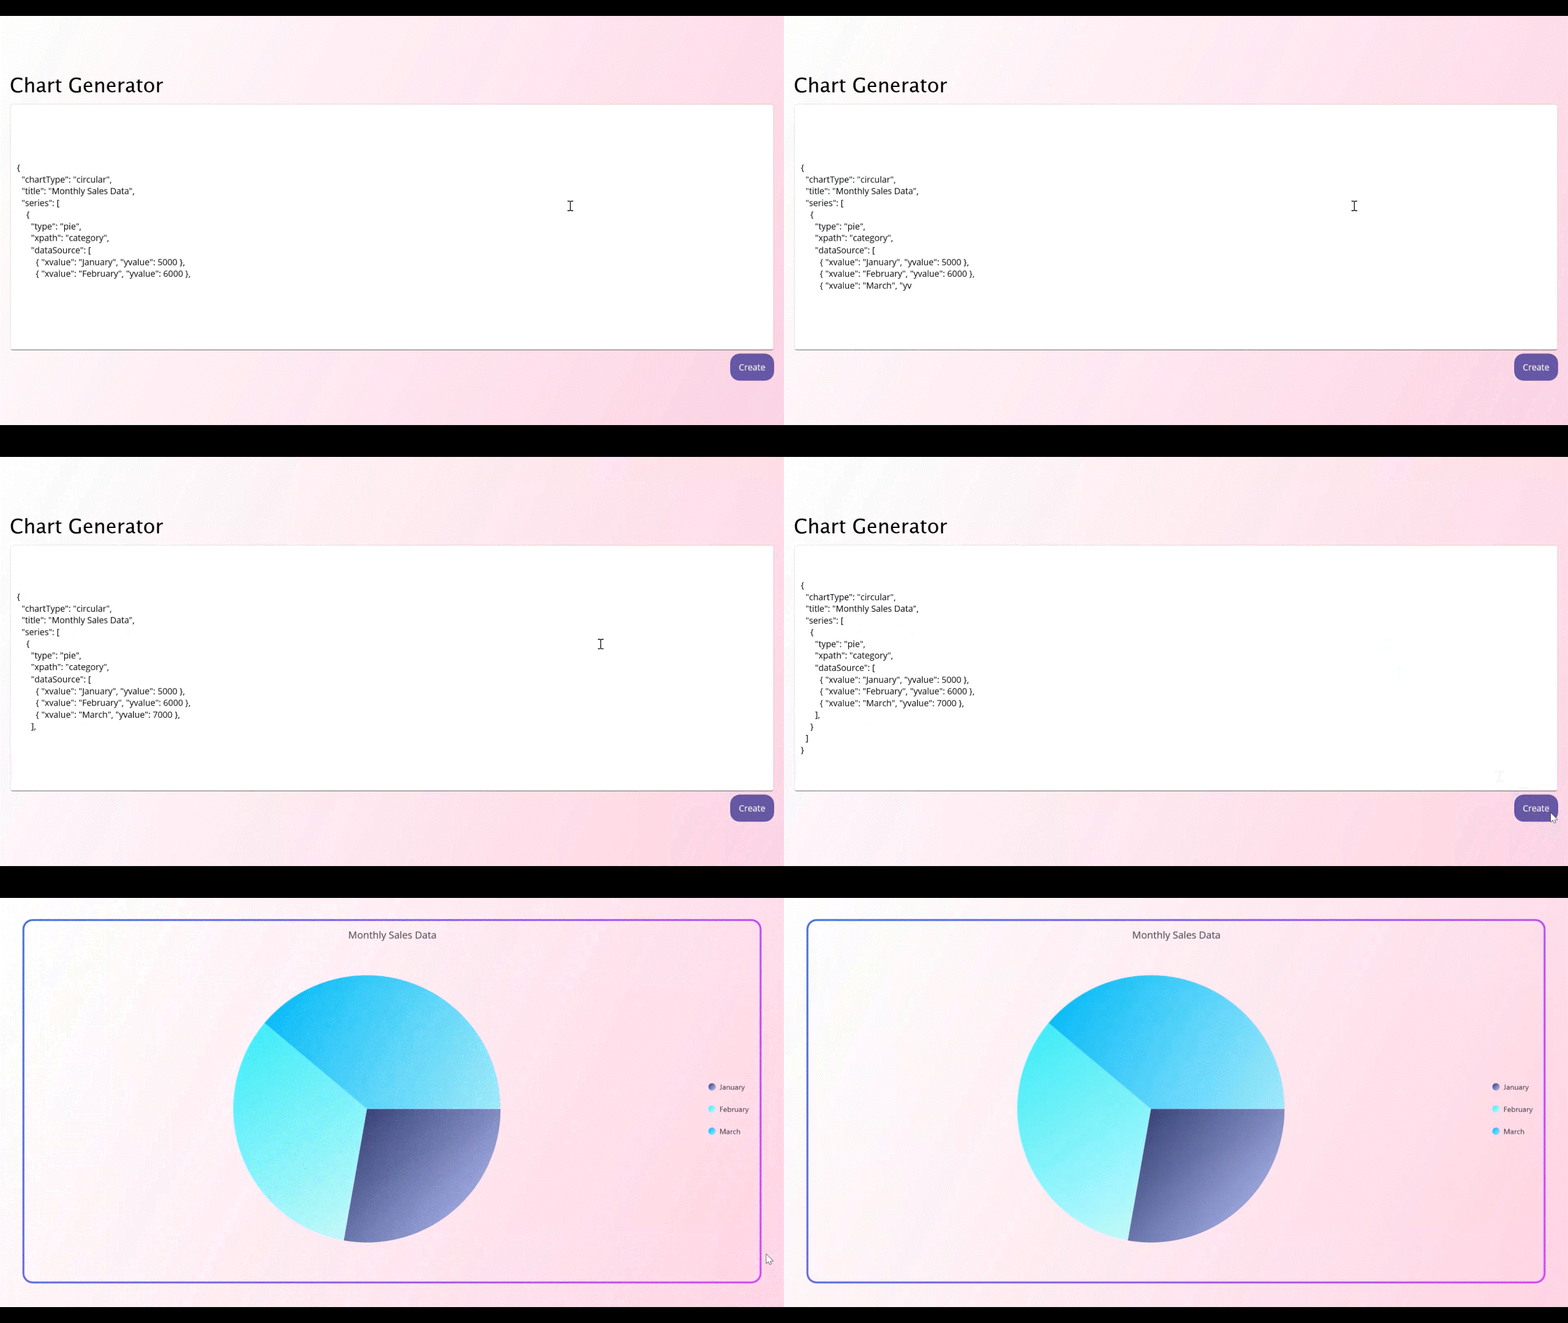
Now, the app will generate a chart based on the JSON input.

Refer to the following output GIF image.

GitHub reference
For more details, refer to the auto-generating charts from JSON with Syncfusion® .NET MAUI Toolkit GitHub demo.
Stay tuned
If you find providing JSON input challenging or feel uncomfortable framing it correctly, we have great news for you! Stay tuned for our next blog, where we’ll demonstrate how to create charts from natural language using an AI engine.
With this upcoming feature, you can describe your data in plain language, and the app will handle the rest—making chart creation even more intuitive and effortless.
Conclusion
Thanks for reading! This auto-chart generator app streamlines the process of creating, visualizing, and exporting charts in .NET MAUI. By leveraging Syncfusion® .NET MAUI Toolkit, you can generate professional-quality charts with just a few clicks.
Whether you’re a developer looking to save time or a user needing quick insights, this app covers you. Try it out and experience the convenience of auto-generating stunning charts!
If you need assistance, please do not hesitate to contact us via our support forum, support portal, or feedback portal. We are always eager to help you!


