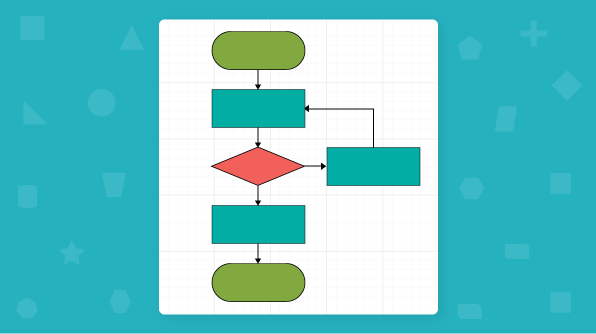

Syncfusion is excited to announce that another valuable control, Diagram, has been included with Syncfusion’s Essential JS 2 (WEB) platform. Diagram control is a fully client-side and light-weight pure JavaScript diagramming library that can be used to create flow charts, organizational charts, mind maps, and BPMN diagrams, and interact across all modern browsers and platforms. It has been built as modules to enable selective referencing, so only the features you need are included in your application. It is interoperable with other third-party frameworks such as Angular, React, and Vue.js. It is not dependent on any third-party libraries or software.


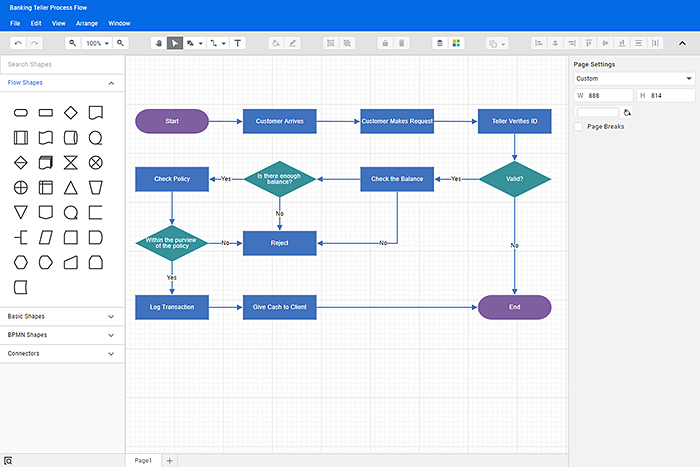
An illustration of our diagram builder application created using diagram control.
In this blog, let’s see the key features, how to get started with our diagram component, and the different modules of diagram component.
Let’s see how to create a simple flow diagram with the diagram component in a web application:
git clone https://github.com/syncfusion/ej2-quickstart.git quickstart
cd quickstart
npm install
System.config({
    paths: {
        'syncfusion:': './node_modules/@syncfusion/',
    },
    map: {
        app: 'app',

        //Syncfusion packages mapping
        "@syncfusion/ej2-base": "syncfusion:ej2-base/dist/ej2-base.umd.min.js",
        "@syncfusion/ej2-data": "syncfusion:ej2-data/dist/ej2-data.umd.min.js",
        "@syncfusion/ej2-navigations": "syncfusion:ej2-navigations/dist/ej2-navigations.umd.min.js",
        "@syncfusion/ej2-inputs": "syncfusion:ej2-inputs/dist/ej2-inputs.umd.min.js",
        "@syncfusion/ej2-popups": "syncfusion:ej2-popups/dist/ej2-popups.umd.min.js",
        "@syncfusion/ej2-buttons": "syncfusion:ej2-buttons/dist/ej2-buttons.umd.min.js",
        "@syncfusion/ej2-lists": "syncfusion:ej2-lists/dist/ej2-lists.umd.min.js",
        "@syncfusion/ej2-splitbuttons": "syncfusion:ej2-splitbuttons/dist/ej2-splitbuttons.umd.min.js",
        "@syncfusion/ej2-diagrams": "syncfusion:ej2-diagrams/dist/ej2-diagrams.umd.min.js",
    },
    packages: {
        'app': { main: 'app', defaultExtension: 'js' }
    }
}); @import '../../node_modules/@syncfusion/ej2/material.css';
import { Diagram, NodeModel, ConnectorModel } from '@syncfusion/ej2-diagrams';
//Initializes the nodes for the diagram
let nodes: NodeModel[] = [
    {
        id: 'NewIdea', height: 60, offsetX: 350, offsetY: 80,
        shape: { type: 'Flow', shape: 'Terminator' },
        annotations: [{
            content: 'Place Order'
        }]
    },
    {
        id: 'Meeting', height: 60, offsetX: 350, offsetY: 160,
        shape: { type: 'Flow', shape: 'Process' },
        annotations: [{
            content: 'Start Transaction'
        }]
    },
    {
        id: 'BoardDecision', height: 60, offsetX: 350, offsetY: 240,
        shape: { type: 'Flow', shape: 'Process' },
        annotations: [{
            content: 'Verification'
        }]
    },
    {
        id: 'Project', height: 60, offsetX: 350, offsetY: 330,
        shape: { type: 'Flow', shape: 'Decision' },
        annotations: [{
            content: 'Credit card valid?'
        }]
    },
    {
        id: 'End', height: 60, offsetX: 350, offsetY: 430,
        shape: { type: 'Flow', shape: 'Decision' },
        annotations: [{
            content: 'Funds available?'
        }]
    },
    {
        id: 'node11', height: 60, offsetX: 580, offsetY: 330,
        shape: { type: 'Flow', shape: 'Process' },
        annotations: [{
            content: 'Enter payment method'
        }]
    },
    {
        id: 'transaction_entered', height: 60, offsetX: 350, offsetY: 630,
        shape: { type: 'Flow', shape: 'Terminator' },
        annotations: [{
            content: 'Log transaction'
        }]
    },
    {
        id: 'node12', height: 60, offsetX: 530, offsetY: 630,
        shape: { type: 'Flow', shape: 'Process' },
        annotations: [{
            content: 'Reconcile the entries'
        }]
    },
    {
        id: 'transaction_completed', height: 60, offsetX: 350, offsetY: 530,
        shape: { type: 'Flow', shape: 'Process' },
        annotations: [{
            content: 'Complete Transaction'
        }]
    },
    {
        id: 'Data', height: 45, offsetX: 150, offsetY: 530,
        shape: { type: 'Flow', shape: 'Data' },
        annotations: [{
            content: 'Send e-mail', margin: { left: 25, right: 25 }
        }]
    },
    {
        id: 'node10', height: 70, offsetX: 525, offsetY: 530,
        shape: { type: 'Flow', shape: 'DirectData' },
        annotations: [{
            content: 'Customer Database', margin: { left: 25, right: 25 }
        }]
    }
];
//Initializes the connector for the diagram
let connectors: ConnectorModel[] = [
    {
        id: 'connector1', sourceID: 'NewIdea', targetID: 'Meeting'
    },
    {
        id: 'connector2', sourceID: 'Meeting', targetID: 'BoardDecision'
    },
    {
        id: 'connector3', sourceID: 'BoardDecision', targetID: 'Project'
    },
    {
        id: 'connector4', sourceID: 'Project', targetID: 'End',
        annotations: [
            { content: 'Yes', style: { fill: 'white' } }
        ]
    },
    {
        id: 'connector5', sourceID: 'End', targetID: 'transaction_completed',
        annotations: [
            { content: 'Yes', style: { fill: 'white' } }
        ]
    },
    {
        id: 'connector6', sourceID: 'transaction_completed', targetID: 'transaction_entered'
    },
    {
        id: 'connector7', sourceID: 'transaction_completed', targetID: 'Data'
    },
    {
        id: 'connector8', sourceID: 'transaction_completed', targetID: 'node10'
    },
    {
        id: 'connector9', sourceID: 'node11', targetID: 'Meeting',
        segments: [
            { direction: 'Top', length: 120 }
        ]
    },
    {
        id: 'connector10', sourceID: 'End', targetID: 'node11',
        annotations: [
            { content: 'No', style: { fill: 'white' } }
        ],
        segments: [
            { direction: 'Right', length: 100 }
        ]
    },
    {
        id: 'connector11', sourceID: 'Project', targetID: 'node11',
        annotations: [
            { content: 'No', style: { fill: 'white' } }
        ]
    },
    {
        id: 'connector12', sourceID: 'transaction_entered', targetID: 'node12',
        style: { strokeDashArray: '2,2' }
    }
];
//Initializes diagram control
let diagram: Diagram = new Diagram({
    width: '100%', height: '700px', nodes: nodes, connectors: connectors,
    //Sets the default values of a node
    getNodeDefaults: (node: NodeModel) => {
        let obj: NodeModel = {};
        obj.width = 145;
        obj.style = { fill: '#357BD2', strokeColor: 'white' };
        obj.annotations = [{
            style: {
                color: 'white',
                fill: 'transparent'
            }
        }];
        return obj;
    },
    //Sets the default values of a connector
    getConnectorDefaults: (obj: ConnectorModel) => {
        if (obj.id.indexOf('connector') !== -1) {
            obj.type = 'Orthogonal';
            obj.targetDecorator = { shape: 'Arrow', width: 10, height: 10 };
        }
    },
});
diagram.appendTo('#container');
npm start
The output will be shown like below.
The diagram component is divided into individual modules by feature. To use a particular feature, inject the required module. The following list describes the modules:
Overall, the JavaScript diagram control can be used to create flow charts, organization charts, mind maps, and BPMN diagrams. It has flexible usage from the application point of view. It was designed to be completely modularized to ensure loading speed.
If you would like to try the diagram component, you can download our free trial. You can visit the diagram source in GitHub and you can check our sample browser and documentation for detailed explanations and the knowledge to proceed further.
If you have any questions or need any clarifications, please let us know in the comments section below. You can also contact us through our support forum or Direct-Trac. We are always happy to assist you!
If you like this blog post, we think you’ll also like the following free e-books:
JavaScript Succinctly
TypeScript Succinctly
AngularJS Succinctly
Angular 2 Succinctly