
TL;DR: Let’s see how to create UML activity diagrams using the Angular Diagram Library. This guide covers setting up an Angular app, installing dependencies, and creating a diagram surface. You’ll learn how to add UML activity shapes using the Symbol Palette and customize elements. Enhance your system design with interactive, workflow-based diagrams.
Unified Modeling Language (UML) activity diagrams are an excellent tool for visually representing a system’s flow of control or data. From modeling complex business processes to defining workflows, UML activity diagrams make it easy to analyze and design systems effectively.
In this article, we’ll explore how to create interactive UML activity diagrams using the Syncfusion Angular Diagram Library.
Refer to the following image.


What is a UML activity diagram?
A UML activity diagram provides a graphical representation of a system’s activities, showing the sequence in which actions are executed. The key elements include:
- Activity nodes: Represent actions or tasks.
- Control flows: Arrows indicating the flow from one activity to another.
- Decision nodes: Diamond-shaped nodes used for branching paths based on conditions.
- Start and end nodes: Special symbols representing the beginning and end of a process.
UML activity diagram notations and their meanings
|
Shape |
Image |
Description |
|
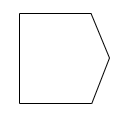
Action |
 |
Represents a specific task or action in the workflow. |
|
Decision |
 |
Represents a decision point in the flow where multiple paths can be taken based on conditions. |
|
MergeNode |
 |
Combines multiple incoming flows into a single outgoing flow. |
|
InitialNode |
 |
Represents the starting point of the activity. |
|
FinalNode |
 |
Indicates the end of an activity flow.
|
|
ForkNode |
Splits a single incoming flow into multiple concurrent outgoing flows.
|
|
|
JoinNode |
 |
Synchronizes multiple concurrent incoming flows into a single outgoing flow.
|
|
TimeEvent |
 |
Represents a delay or timed trigger in the activity.
|
|
AcceptingEvent |
 |
Represents an event that waits for a specific signal or condition.
|
|
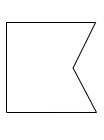
SendSignal |
 |
Represents the action of sending a signal.
|
|
ReceiveSignal |
 |
Represents the action of receiving a signal.
|
|
StructuredNode |
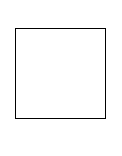 |
Represents a group of actions executed as a single unit or block.
|
|
Note |
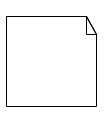 |
Represents a comment or additional information associated with the diagram.
|
|
Object/ Control |
 |
A connector object representing a relationship with UML activity nodes |
|
Exception |
 |
A connector object representing a relationship Exception with UML activity nodes |
Prerequisites
- Install Node.JS version – 14.15.1/14.17.3/18.20.0
Creating a diagram surface
Let’s create a diagram surface by following these steps.
Step 1: Create a folder and name it as a UML Activity Diagram.
Step 2: Open your terminal or command prompt and install the Angular CLI globally using the following command.
npm install -g @angular/cli
Step 3: Create a new Angular app and use the following command to replace my-app with your desired app name. Here, we’ll name the app as uml-activity.
ng new uml-activity
Step 4: Navigate to your app’s directory. Change your working directory to the newly created app using the following command.
cd uml-activity
Step 5: Run the following command to launch your Angular app.
ng serve
This will open your app in your default web browser at http://localhost:4200/.
Step 6: Then, open the package.json file and add the following necessary dependency packages.
"dependencies": {
    "rxjs": "7.8.1",
    "tslib": "2.6.3",
    "zone.js": "0.14.2",
    "@angular/core": "17.0.1",
    "@angular/forms": "17.0.1",
    "@angular/common": "17.0.1",
    "@angular/router": "17.0.1",
    "@angular/compiler": "17.0.1",
    "@angular/animations": "17.0.1",
    "@angular/platform-browser": "17.0.1",
    "@syncfusion/ej2-base": "26.1.37",
    "@syncfusion/ej2-angular-base": "26.1.41",
    "@syncfusion/ej2-diagrams": "26.1.41",
    "@syncfusion/ej2-angular-diagrams": "26.1.41",
    "@syncfusion/ej2-buttons": "26.1.40",
    "@syncfusion/ej2-data": "26.1.41",
    "@syncfusion/ej2-inputs": "26.1.41",
    "@syncfusion/ej2-lists": "26.1.35",
    "@syncfusion/ej2-navigations": "26.1.41",
    "@syncfusion/ej2-popups": "26.1.41",
    "codemirror": "5.65.15",
    "marked": "0.3.19",
    "@types/codemirror": "0.0.56",
    "@types/marked": "0.3.0",
    "@angular/http": "7.2.16",
    "rxjs-compat": "6.6.7",
    "reflect-metadata": "0.2.2",
    "core-js": "2.6.9"
},
Step 7: Use the following command to install all dependent packages.
npm install
Step 8: Now, add the dependent scripts and style CDN reference links to the index.html file.
<head>
  <meta charset="utf-8">
  <title>Angular UML Activity Diagram</title>
  <base href="/">
  <meta name="viewport" content="width=device-width, initial-scale=1">
  <link rel="icon" type="image/x-icon" href="favicon.ico">
  <script src="https://cdn.syncfusion.com/ej2/syncfusion-helper.js" type ="text/javascript"></script>
  <link href="https://cdn.syncfusion.com/ej2/26.1.35/material.css" rel="stylesheet"/>
</head>
Step 9: To include the Angular Diagram component in your app, import it from the ej2-angular-diagrams package. The required arguments, such as the width, height, and collection of nodes and connectors, must be included in the app.component.html file.
Refer to the following code example.
<div id="diagram-space" class="sb-mobile-diagram">
   <ejs-diagram #diagram id="diagram" width="100%" height="100%" >
   </ejs-diagram>
</div >
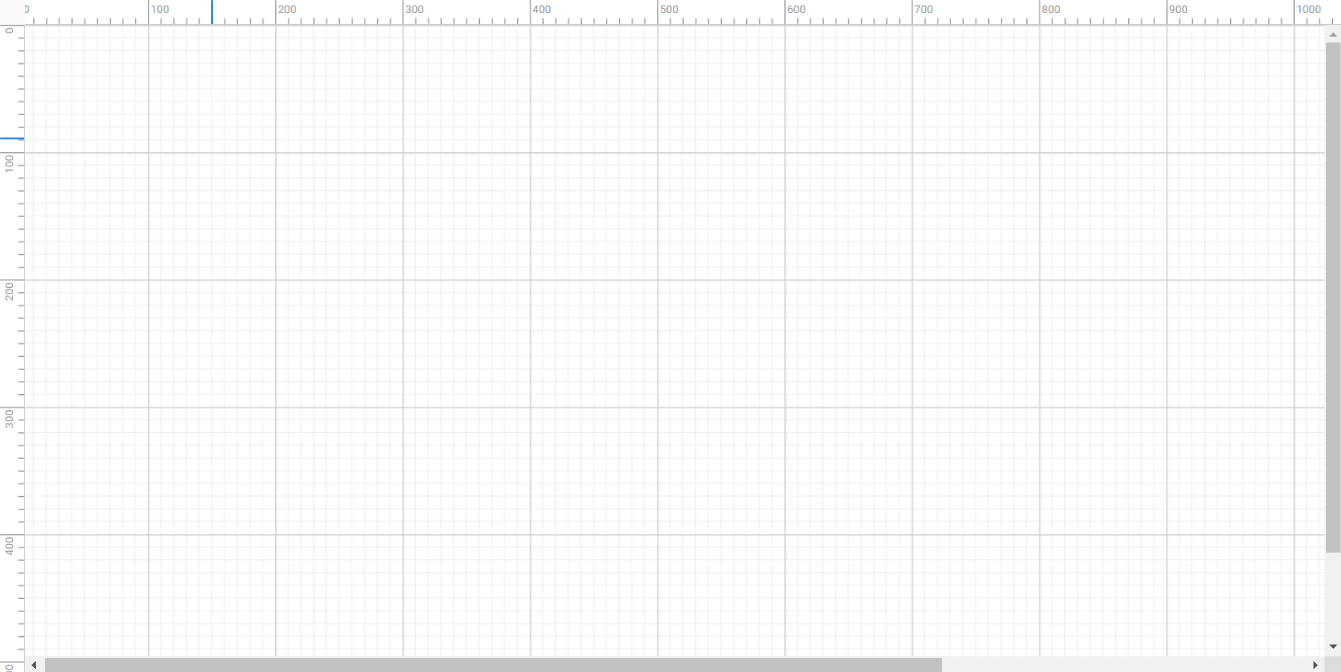
The following image shows the initial diagramming page.
Note: For more details, refer to the Getting started with Angular Diagram Library documentation.
Adding UML activity shapes in the symbol palette
The Angular Diagram Library provides a gallery of reusable nodes and connectors called SymbolPalettes. It displays a collection of palettes, each showing a set of nodes and connectors. We can drag and drop them onto the diagram canvas any number of times.
The UML built-in shapes can be easily rendered in a symbol palette. The symbols property of palettes is used to define UML symbols using the necessary parameters. This feature allows you to add a collection of predefined UML symbols to the palette, making your UML diagramming app more versatile.
Follow these steps to create a diagram symbol palette with UML activity shapes.
Step 1: Prepare the container
First, start by creating an HTML <div> element to act as the container for the symbol palette.
Refer to the following code example.
<div id="paletteSpace" >
  <SymbolPaletteComponent id="symbolpalette"
       width={"100%"}
       height={"500px"}>
  </SymbolPaletteComponent>
</div>
Step 2: Initialize the symbol palette
Next, initialize the Angular Diagram symbol palette by specifying the necessary parameters, such as width and height, and the collection of symbols to be included in the palette.
Refer to the following code example.
<SymbolPaletteComponent id="symbolpalette"
	expandMode="Multiple"
	palettes={
	[ {
	    id: "umlActivity",
           expanded: true,
           symbols: umlActivityShapes,
           title: "UML Shapes"
          },
          {
           id: "connectors",
           expanded: true,
           symbols: connectorSymbols,
           title: "Connectors"
          }
      ]}
      width={"100%"} height={"505px"}
     symbolHeight={100} symbolWidth={100}
 </SymbolPaletteComponent>
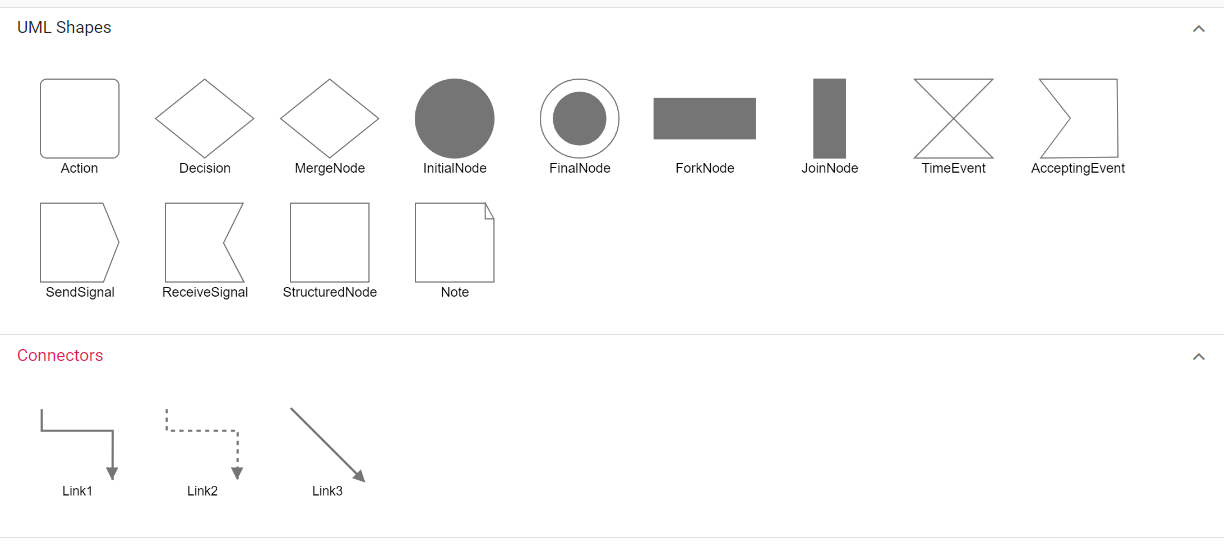
Step 3: Customize the symbol collection
Finally, define the collection of symbols to be included in the palette, which can be customized according to your needs. Here, we have added the UML Activity shapes and connectors.
Refer to the following code example.
let umlActivityShapes = [
  { id: 'Action', shape: { type: 'UmlActivity', shape: 'Action' } },
  { id: 'Decision', shape: { type: 'UmlActivity', shape: 'Decision' } },
  { id: 'MergeNode', shape: { type: 'UmlActivity', shape: 'MergeNode' } },
  { id: 'InitialNode', shape: { type: 'UmlActivity', shape: 'InitialNode' } },
  { id: 'FinalNode', shape: { type: 'UmlActivity', shape: 'FinalNode' } },
  { id: 'ForkNode', shape: { type: 'UmlActivity', shape: 'ForkNode' } },
  { id: 'JoinNode', shape: { type: 'UmlActivity', shape: 'JoinNode' } },
  { id: 'TimeEvent', shape: { type: 'UmlActivity', shape: 'TimeEvent' } },
  { id: 'AcceptingEvent', shape: { type: 'UmlActivity', shape: 'AcceptingEvent' } },
  { id: 'SendSignal', shape: { type: 'UmlActivity', shape: 'SendSignal' } },
  { id: 'ReceiveSignal', shape: { type: 'UmlActivity', shape: 'ReceiveSignal' } },
  { id: 'StructuredNode', shape: { type: 'UmlActivity', shape: 'StructuredNode' } },
  { id: 'Note', shape: { type: 'UmlActivity', shape: 'Note' } },
];
let connectorSymbols = [
    {
        id: 'Link1', type: 'Orthogonal', sourcePoint: { x: 0, y: 0 }, targetPoint: { x: 40, y: 40 },
        targetDecorator: { shape: 'Arrow', style: { strokeColor: '#757575', fill: '#757575' } }, style: { strokeWidth: 2, strokeColor: '#757575' }
    },
    {
        id: 'Link2', type: 'Orthogonal', sourcePoint: { x: 0, y: 0 }, targetPoint: { x: 40, y: 40 },
        targetDecorator: { shape: 'Arrow', style: { strokeColor: '#757575', fill: '#757575' } }, style: { strokeWidth: 2, strokeDashArray: '4 4', strokeColor: '#757575' }
    },
    {
        id: 'Link3', type: 'Straight', sourcePoint: { x: 0, y: 0 }, targetPoint: { x: 40, y: 40 },
        targetDecorator: { shape: 'Arrow', style: { strokeColor: '#757575', fill: '#757575' } }, style: { strokeWidth: 2, strokeColor: '#757575' }
    }
];
Refer to the following image.
Note: Refer to the symbol palette in Angular Diagram documentation for more details on adding symbols, grouping, and customizing the symbol palette appearance.
Rendering the UML shapes in Angular Diagram
UML activity nodes
The Angular Diagram Library supports different types of UML Activity shapes, as mentioned in the table above.
Let’s create a UML activity diagram based on customer call log support.
1. To create a UML activity, define the type as UmlActivity and set the list of built-in shapes in the shape property as InitialNode. Refer to the following code example.
let node = [
{
        id: "Start",
        height: 40,
        width: 40,
        offsetX: 300,
        offsetY: 40,
        shape: { type: "UmlActivity", shape: "InitialNode" }
      },
];
Refer to the following image.
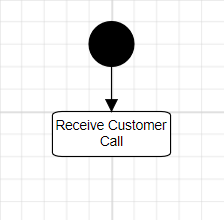
2. The next step is to log the customer call as Received Customer Call. We can define this by setting the shape property as Action as a reference of action.
[{
        id: "Start",
        height: 40,
        width: 40,
        offsetX: 300,
        offsetY: 40,
        shape: { type: "UmlActivity", shape: "InitialNode" }
      },
      {
        id: "ReceiveCall",
        height: 40,
        width: 105,
        offsetX: 300,
        offsetY: 120,
        shape: { type: "UmlActivity", shape: "Action" },
        annotations: [{ content: "Receive Customer Call" }]
      }],
UML activity connector
To establish a UML activity connector, specify the type of connector shape as UmlActivity and define the flow as either Exception, Control, or Object. This configuration delineates the nature of the connection, allowing for a precise representation of the interaction within the activity diagram.
The following code illustrates how to create a UmlActivity connector.
var diagram;

var connector = {
  id: 'connector',
  type: 'Straight',
  //Define connector start and end points
  sourcePoint: { x: 100, y: 100 },
  targetPoint: { x: 200, y: 200 },
  shape: { type: 'UmlActivity', flow: “Object” },
};

diagram = new ej.diagrams.Diagram({
    width: '100%',
    height: '600px',
    connectors: [connector],
},'#element');
Refer to the following image.
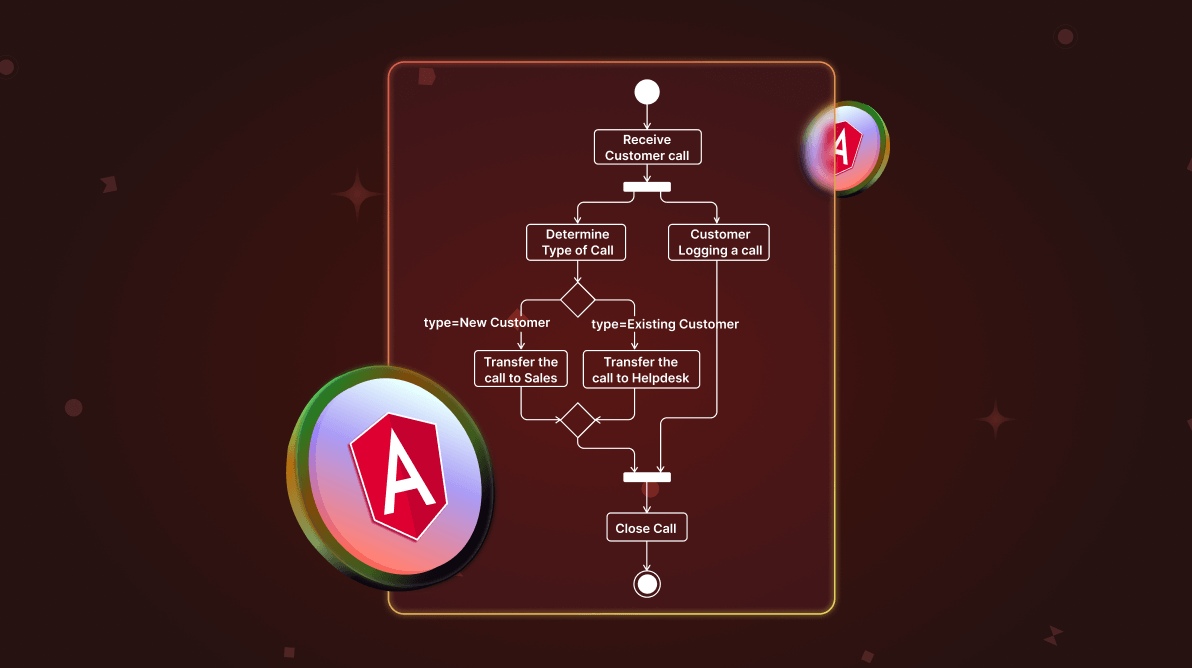
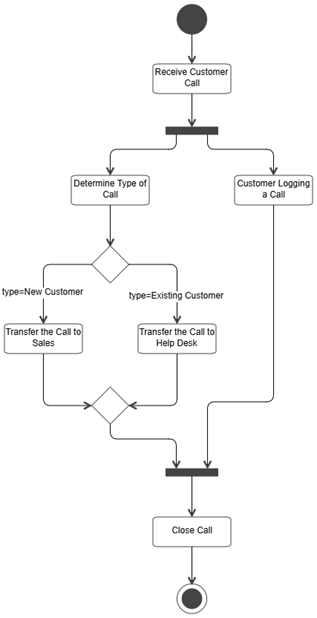
UML activity diagram flow
The following UML activity diagram flow illustrates a structured process for managing customer calls, covering key actions like receiving calls, determining customer type, logging details, and making decisions. It uses nodes for parallel tasks, synchronization, and flow merging to ensure efficient and seamless workflow execution using Diagram nodes and connectors.
Nodes
- Start (InitialNode): Marks the entry point of the process.
- ReceiveCall (Action): Represents receiving a customer’s call.
- ForkNode: Splits the process into two parallel flows.
- Determine (Action): Determines the type of call.
- Log (Action): Logs the customer’s call.
- Decision: Decides the call’s next step based on the customer type:
-
- New customer: Transfers the call to sales.
- Existing customer: Transfers the call to the help desk.
- MergeNode: Merges the paths after handling customer calls.
- JoinNode: Synchronizes the logged call and merged paths.
- CloseCall (Action): Closes the call.
- FinalNode: Marks the process end.
Flow
- The process begins at the Start node.
- The call was Received and split at the ForkNode.
- In parallel:
- Determine the call type leads to a Decision:
- New customers are transferred to Sales.
- Existing customers are transferred to the Help Desk.
- The call is Logged.
- Determine the call type leads to a Decision:
- After call handling, paths converge at the MergeNode and then join at the JoinNode with the logged data.
- Finally, the call is Closed, and the process ends at the FinalNode.
The diagram effectively models parallel processing, decision-making, and merging flows in a customer call management scenario.
Adding shapes at runtime
Drag and drop the desired symbols from the palette to create a UML activity flowchart dynamically. Double-click on nodes and connectors to edit their content and include flow data in the diagram objects.
Refer to the following GIF image.
Loading and saving the diagram
The Angular Diagram Library provides a useful feature that allows you to save your work and resume it later by loading the saved diagram back onto the diagram canvas.
To save your current diagram, select the Save Diagram option in the toolbar. This will save your diagram as a file on your local drive.
To load an existing diagram file, select the Open Diagram option in the toolbar. This will open the file dialog box. From there, you can browse and select the saved diagram file that you want to load.
This feature provides great flexibility and convenience, allowing you to easily pick up where you left off on a diagram or to make changes to a previously saved diagram. It’s an essential feature for any diagramming app that enables users to create and manage complex diagrams.
Refer to the following GIF image.
Export a diagram
You can export the created UML activity diagram as an image file in different formats, such as JPEG, PNG, and SVG. By exporting the diagram as an image file, you can easily share it via email or other digital means or embed it in a document or presentation.
To do this, click the export button in the toolbar and select the required image file format to save the UML Activity diagram. You can also export only the content area of the diagram by excluding the blank areas or export the entire diagram (including blank areas) based on the width and height specified in the page settings.
Refer to the following image.
Print a diagram
To print a diagram, click the Print button in the toolbar. This will open the Print dialog box, where you can select your printer and customize the print settings, such as orientation, paper size, and page margins. Then, click on the Print button to print the UML Activity diagram.
Refer to the following image.
Pan and zoom
The Angular Diagram Library supports the following panning and zooming options.
- Pan using the scrollbars: The most straightforward way to pan a diagram is to use the scrollbars on the right side and bottom. These allow you to scroll the diagram in the desired direction.
- Pan using the mouse wheel: You can also pan a diagram by using the mouse wheel. To scroll up or down, rotate the mouse wheel forward or backward; to scroll left or right, hold Shift while rotating the scroll wheel forward or backward.
- Pan using the pan tool: You can also pan a diagram by selecting the Pan tool from the toolbar. Then, hold down the left mouse button and drag the mouse to move the diagram in any direction. Refer to the following image.
Panning a UML activity diagram - Zoom using keyboard shortcuts: The most efficient way to zoom in and out of the diagram is to use the Ctrl + mouse wheel shortcut.
- Zoom using the toolbar option: You can also zoom in or out in a diagram using the zoom dropdown in the toolbar. Refer to the following image.
Reference
For more details, refer to the creating a UML activity Diagram using Angular Diagram Library demo on StackBlitz.
Conclusion
Thanks for reading! This blog shows how to easily create a UML activity diagram using the Syncfusion Angular Diagram Library. Similarly, you can create diagram creation apps like an organization chart creator, a flow chart creator, or a network diagram creator.
If you’re already a Syncfusion user, you can download the product setup from our website. Otherwise, you can download a free 30-day trial.
Please let us know in the comments section below if you have any questions. You can also contact us through our support forum, support portal, or feedback portal. We are always happy to assist you!


 No spam, just valuable updates.