
![Create an Interactive Business Analytics Dashboard in Blazor with Syncfusion® [Webinar Show Notes]](https://www.syncfusion.com/blogs/wp-content/uploads/2025/03/Create-an-Interactive-Business-Analytics-Dashboard-in-Blazor-with-Syncfusion®-Webinar-Show-Notes.jpg)
This blog provides the show notes for our March 20, 2025, webinar, “Create an Interactive Business Analytics Dashboard in Blazor with Syncfusion®.” The webinar was presented and hosted by Shriram, senior product manager at Syncfusion®. If you missed the webinar, or would like to watch it again, you can do so on our YouTube channel or in the following embedded player.
Overview
This webinar shows attendees how to create an interactive business analytics dashboard in Blazor using Syncfusion® Blazor components. Senior Product Manager Shriram demonstrates how to build a dynamic, real-time dashboard that provides valuable insights into business performance. From setting up the environment to live coding, this webinar covers everything you need to create a fully functional dashboard.
Agenda
Introduction
Learn what business analytics dashboards are, why they matter, and the key elements required for an effective dashboard, including real-time data updates, relevant KPIs, and clear visuals.
Why Business analytics dashboards matter
Understand the significance of business dashboards in simplifying decision-making, tracking key performance indicators, and providing actionable insights at a glance.
Live demo overview
Shriram gives an overview of what the live demo entails, including:
- Setting up Syncfusion® Blazor components.
- Adding a dashboard layout, charts, grids, and KPI cards.
- Setting up interactive filtering.
Setting up Syncfusion® Blazor components
The demo starts with installing essential Syncfusion® Blazor packages for layouts, charts, grids, cards, and calendars. These components form the backbone of the dashboard. Learn how to configure services, import namespaces, and add necessary style sheets and scripts.
Building the dashboard layout
We design a structured dashboard layout using the Blazor Dashboard Layout component, including:
- Creating panels for KPIs, charts, and grids.
- Configuring panel size, column span, and positioning.
- Adding interactivity with drag-and-drop and resizing features.
Adding KPI cards
We add four KPI cards displaying total revenue, total orders, active customers, and customer retention rate using the Blazor Card component.
Implementing Line and Bar Charts
Shriram shows you how to:
- Render a multicolored line chart to display sales revenue trends.
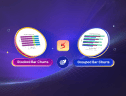
- Implement a bar chart to visualize order distribution by country.
Creating an interactive DataGrid
We use Blazor DataGrid to display product performance with sortable and filterable columns, formatted values, and interactive features.
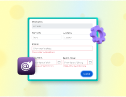
Enhancing the dashboard with Date Range filters
In this section, we add a DateRangePicker to allow users to filter dashboard data dynamically. Learn how to bind data sources based on the selected date range and reflect filtered data in the sales trends chart.
Q&A
Q: Is there an aggregate package that contains all of these?
A: Yes, the package Syncfusion.Blazor provides 100+ Syncfusion® native Blazor components that work seamlessly with Blazor web apps (Server, WebAssembly, and auto modes), as well as standalone WebAssembly and Server projects.
Q: Is there a version without a dependency on any third-party CSS libraries available? I am attempting to de-bootstrap myself.
A: No, but if you wanted to switch to a non-Bootstrap theme, there are other built-in themes included in our Blazor themes library, the details of which can be found on this page.
Q: Is there a way to add sidebar or navlink on the left-hand side?
A: The default Blazor web app contains a navigation menu that was removed from the layout for the purpose of this demo. You can also use the Blazor Sidebar to add a sidebar or navigation links on the left-hand side.
Q: What version of .NET did you use in this example, and what versions of .NET are compatible?
A: .NET 8.0 has been used in this example, and we support .NET 8, .NET 9, and .NET 10 Preview 1.
Q: Is all the code in the Home.razor a mix of HTML and JavaScript?
A: The code in the Home.razor file is a mix of HTML, CSS, and C#.
Q: How can we use a chart as the filter for other charts?
A: A chart can be used as a filter for other charts with the help of various events available in Syncfusion® Charts, similar to the DateRangePicker event used in the demo. You can use the following resources for reference:
Q: Can we get source code or a GitHub repo link?
A: Please find the source code in this GitHub repository.
Q: If we change the interactivity type from server to auto, will this code work as it is?
A: Yes, and the following documentation will help you get started with a Blazor web app with different interactive render modes.
Q: So, if I understand, we cannot create the same project with WASM or I am wrong?
A: Our components support web apps (auto, Server, and WebAssembly modes).
Q: Will this code work in responsive mode, i.e., for mobile phones or other devices?
A: Yes, this code will work in responsive mode. Our components support adaptive and responsive scenarios.
Conclusion
By the end of this webinar, viewers had a fully functional, interactive business analytics dashboard built with Syncfusion® Blazor components. From KPI tracking to advanced filtering, this dashboard provides a streamlined way to analyze key business metrics in real-time.
Stay tuned for upcoming webinars that explore more features and use cases.


 No spam, just valuable updates.