
TL; DR: Explore how to utilize React Data Grid to build a robust stock trading dashboard with features like sector filtering, real-time data updates, and integrated analytics.
In the fast-evolving world of stock trading, building effective analysis software is essential. This article highlights how our Syncfusion React Data Grid simplifies creating trading analysis tools. Its user-friendly design enables real-time stock price display, market trend tracking, and seamless analysis of top gainers and losers.
The grid’s seamless integration with the React Charts provides robust technical analysis features, aiding the visualization of stock performance through trading formulas. Furthermore, the React Card component simplifies presenting vital news and updates, making it a comprehensive tool for traders.
Refer to the following image.
Here’s a detailed explanation of its features:
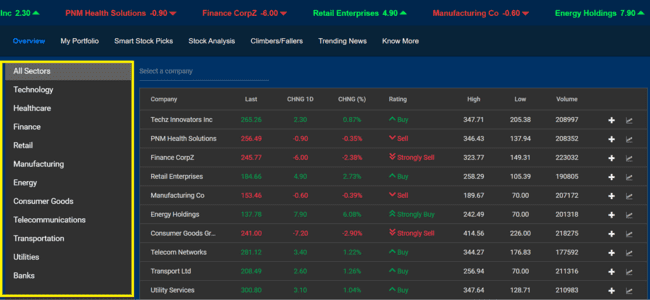
- Sector-based filtering (left sidebar): The left panel allows stock to be filtered by sectors, including technology, healthcare, finance, retail, manufacturing, and others, enhancing focus and efficiency.
- Search functionality (top section): Use the Select a company search bar to quickly find specific stocks. This enhances usability, especially for portfolios with diverse holdings.
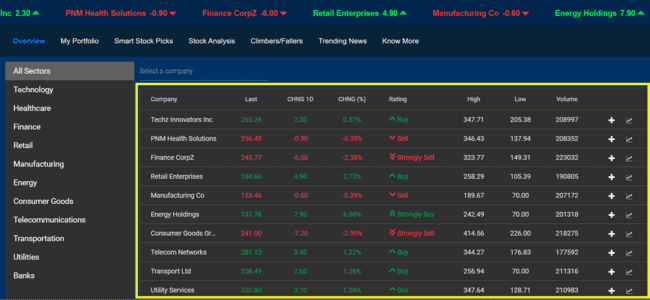
- Primary stock grid (highlighted table): The central grid displays key stock data with columns showing:
- Company name: Identifies the stock.
- Last Price: Shows the latest trading price.
- CHNG 1D: Reflects the one-day price change.
- CHNG (%): Displays the percentage change for better comparison.
- Rating: Highlights the stock’s rating (e.g., Buy, Sell, Strongly Buy, Strongly Sell) with intuitive color coding.
- High/low prices: Indicates Day’s highest and lowest prices.
- Volume: Represents the number of shares traded, offering insights into market activity.
- A plus icon (+): Used to add stocks to your portfolio or view detailed data.
- A chart icon: For graphical representations of stock performance, aiding in analysis. This icon is added to the grid column using the command column feature.
- Dynamic header information: Displays a summary of key stocks with price changes, using green for positive and red for negative changes to provide immediate insight.
- User-friendly navigation: Navigate through functionalities with tabs like My Portfolio, Smart Stock Picks, Stock Analysis, Climbers/Fallers, Trending News, and Know More for seamless exploration.
This well-organized module is designed for efficient stock management, offering a comprehensive and interactive interface for users to analyze, filter, and act on stock data.
Why choose React Data Grid?
Here are compelling reasons to choose our React Data Grid for building the trading analysis app:
- High performance: Load millions of records in seconds with optimized performance.
- Seamless data binding: Easily bind to local and remote data sources like JSON, OData, WCF, and RESTful web services.
- Adapts to any resolution: Functions seamlessly across desktops, touch screens, and mobile devices (iOS, Android, Windows).
- Flexible editing: Simplifies CRUD operations with support for business objects or remote data services.
- Custom templates: Create custom user experiences with a wide range of template options.
- Customizable themes: Choose from over 5 built-in themes like Fluent, Tailwind CSS, Bootstrap, Material, and Fabric and customize them with the Theme Studio tool.
- Easy export and printing: Export data to formats such as Excel, PDF, and CSV, and print all rows or just the current page effectively.
- Globalization and localization: Format dates, currency, and numbers according to locale.
- State-of-the-art features: Utilize features like lazy load grouping, freeze columns, powerful filtering, bulk editing, responsive columns, and state management.
- Web accessibility: Fully supports web accessibility, ensuring usability for all users.
- Ease of use: Minimal configuration required, with intuitive API names that simplify usage.
Building your app environment
Prerequisites
- Install node.js 16.0.
- If you have not previously installed the React packages or have an older version of node.js, you can run the following command to install them:
npm install -g create-react-app
Step 1: Create a React app
To create a React app, you can execute the following command:
npx create-react-app my-app
cd my-app
npm start
or
yarn create react-app my-app
cd my-app
yarn start
To set up a React app in a TypeScript environment, run the following command:
npx create-react-app my-app --template typescript
cd my-app
npm start
Besides using the npx package runner tool, you can also create an app using the npm init command. To begin with the npm init command, upgrade the npm version to npm 6+:
npm init react-app my-app
cd my-app
npm start
Note: In the following demo, we’ll create a React app in a JavaScript environment.
Step 2: Adding Syncfusion React packages
Once you have created the React app, install the required Syncfusion React component packages. All Syncfusion React (Essential JS 2) packages are published on the NPM public registry. Choose the components you want to install.
In this demo, we’ll use the following Syncfusion React components to build our trading portfolio app:
- DataGrid Component
- Carousel Component
- DataManager
- Card Component
- DropDownList Component
- Sidebar Component
- ListView Component
- QueryBuilder Component
- Chart Component
To install the Syncfusion React packages, you can copy and paste them into your package.json file’s dependencies section.
{
  "name": "quickstart",
  "version": "0.1.0",
  "private": true,
  "dependencies": {
    "@syncfusion/ej2-base": "*",
    "@syncfusion/ej2-react-querybuilder": "*",
    "@syncfusion/ej2-data": "*",
    "@syncfusion/ej2-react-charts": "*",
    "@syncfusion/ej2-react-splitbuttons": "*",
    "@syncfusion/ej2-react-dropdowns": "*",
    "@syncfusion/ej2-react-grids": "*",
    "@syncfusion/ej2-react-navigations": "*",
    "@syncfusion/ej2-react-lists": "*",

     . . .
}
Step 3: Add CSS reference
After installing the Syncfusion component packages, import the required themes based on the components used.
Syncfusion React components come with built-in themes that are available in the installed packages. You can adapt the React components based on the app style by referring to any built-in themes.
Since this app uses many components, we’ll refer to the common CSS file, which contains all the component CSS through CDN.
[./public/index.html]
<link href=”https://cdn.syncfusion.com/ej2/ 27.2.2/ material3.css” rel=”stylesheet” />
Ensuring seamless app implementation
Once you have completed all the initial setup, you can begin implementing the app step by step.
Step 1: Module overview
The app overview module is designed using various Syncfusion components to enhance functionality and user experience. It offers a detailed view of all available stocks and their information. Users can easily add stocks to their portfolios and filter them by category for better organization and navigation.
Refer to the following image.
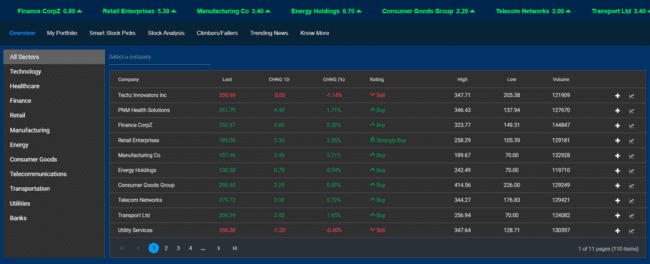
The Syncfusion React components used in this module include:
- Grid: To efficiently display stock details and prices, featuring a command column for integrating custom buttons. This allows you to easily add stocks to your portfolios and analyze their performance.
React Data Grid stock market trends Grid
- Sidebar: Designed as a convenient left-side navigation panel, making it easy to access various options.
React Data Grid with Sidebar
- Multiselect: Allows selection of multiple stocks, dynamically displaying details within the grid view.
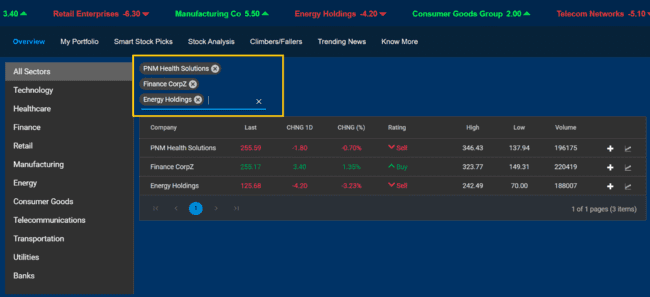
React Data Grid with MultiSelect Dropdown
Step 2: Portfolio and module descriptions
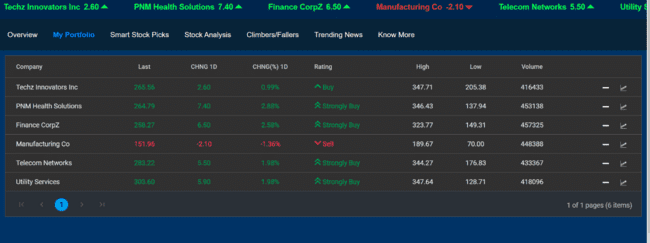
In this module, the React Grid is used in the portfolio section to display the stocks selected by the user. The grid is populated with comprehensive stock details, including the company’s name, last price, daily change, percentage change, rating, high and low prices, and trading volume.
Additionally, a custom button is added to the grid using the Grid’s Command Column feature, enabling users to remove stocks from the portfolio and analyze stock performance. This functionality ensures that users can effectively manage and monitor their selected stocks while gaining detailed insights into each stock.
Refer to the following image.
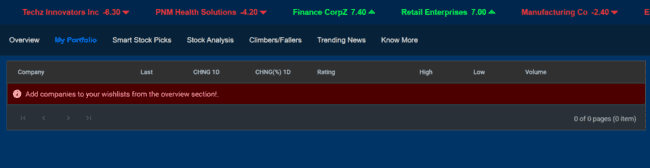
If no stocks are added to the portfolio, the grid displays a clear and informative message: “Add companies to your wishlist from the overview section!“. This message directs users to the overview section to add stocks, ensuring the portfolio remains interactive and easy to navigate, even when no stocks are currently selected.
Refer to the following image.
Step 3: Smart stock picks module
It is designed to help users filter and identify stocks based on specific criteria, making it easier to manage portfolios and improve decision-making. This module incorporates the following Syncfusion React components:
React Query builder
- The React Query Builder enables advanced filtering by allowing users to define complex conditions.
- Logical operators like “AND” and “OR” can be used to create rules for fields such as Last Price, High, Rating, and more.
- This functionality allows precise filtering to align with individual preferences or investment strategies.
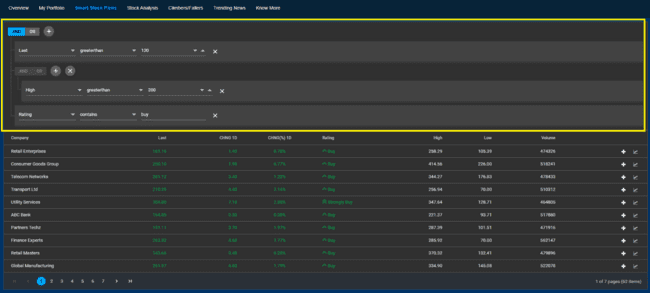
React Data Grid Query Builder
React Grid component
- Displays filtered results in a structured tabular format.
- Key details, including Company Name, Last Price, Change (1D and %), Rating, High, Low, and Volume, are neatly organized for easy analysis.
- The grid includes a command column with buttons for actions like adding stocks to a portfolio or viewing performance charts.

React Data Grid Market Trends Grid
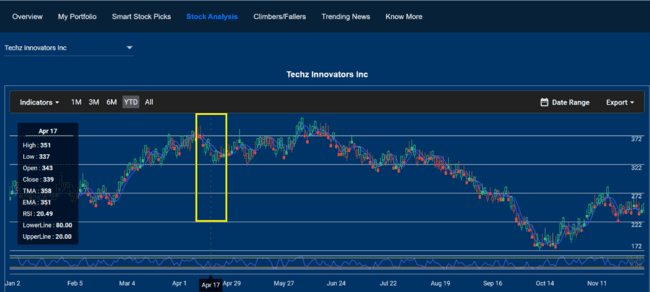
Step 4: Stocks analysis module
This module uses the React Charts to create interactive and customizable data visualizations. It supports a variety of chart types, including line, bar, pie, and candlestick charts, and is ideal for apps such as sales analysis, financial data representation, and performance monitoring.
The component is specifically used to display candlestick charts for tracking stock price movements across different timeframes (e.g., 1M, 3M, YTD). These charts highlight essential stock details, such as high, low, open, and close values, helping users easily identify trends.
Refer to the following image.

The component incorporates various technical indicators, such as EMA (Exponential Moving Average), SMA (Simple Moving Average), RSI (Relative Strength Index), and Bollinger Bands, aiding market pattern analysis and making informed decisions. Users can toggle these indicators on and off based on their preferences.
Refer to the following image.

Its interactive features, such as hover tooltips, provide detailed insights into individual data points with specific periods.
Refer to the following images.

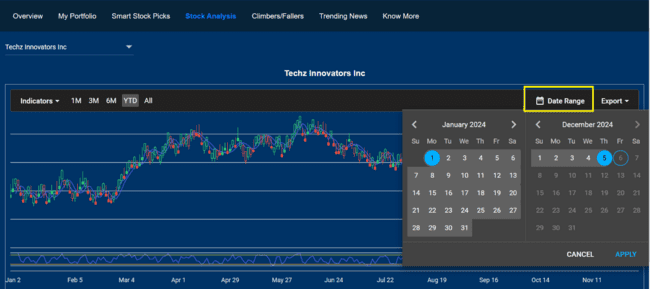
Additionally, the export functionality allows users to download chart data in multiple formats (e.g., PNG, PDF, CSV), facilitating offline analysis and reporting.
Refer to the following image.
By integrating the React Charts component, the module ensures a seamless and visually rich experience for analyzing and tracking stock performance.
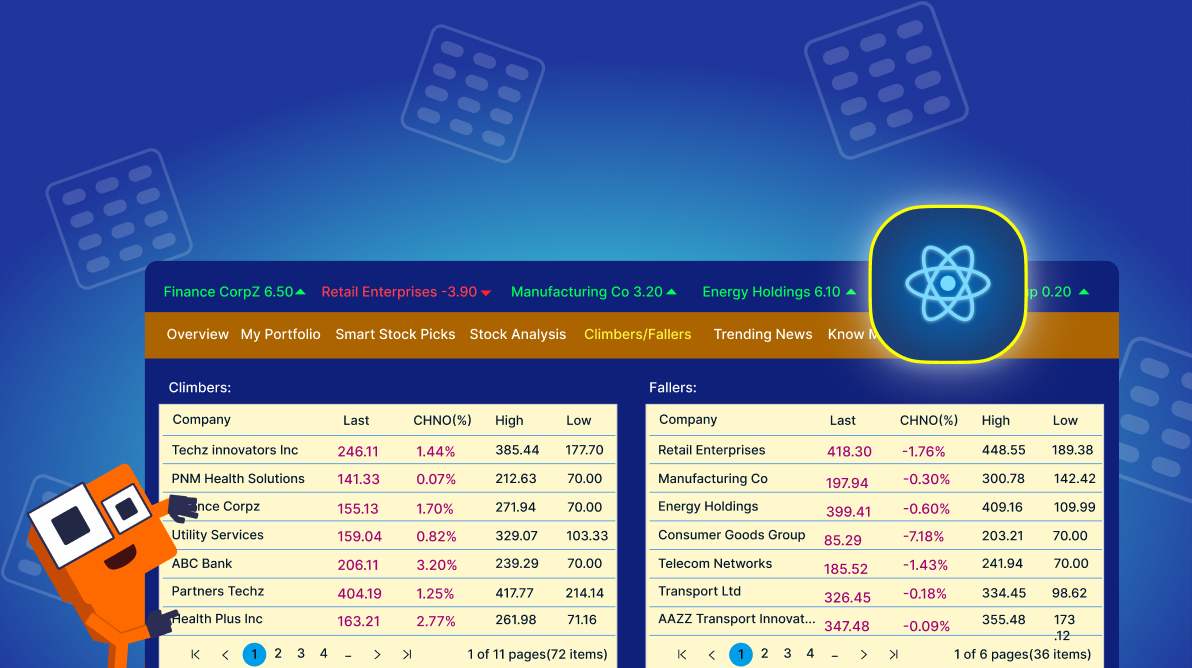
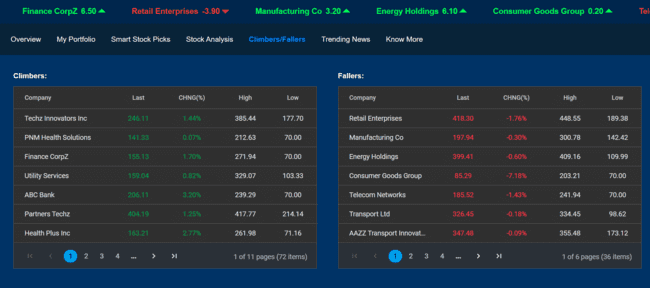
Step 5: Climbers/fallers module
This module helps investors monitor stock trends, enabling them to make strategic decisions about buying or selling shares. By analyzing climbers (stocks on an upward trend) and fallers (stocks on a downward trend), users can identify market opportunities and potential risks.
Using the React Grid component, we can display detailed information about climbers and fallers. The grid showcases key stock details such as company name, current price, percentage change, trading volume, and other relevant metrics. Its interactive features, including sorting and pagination, make it easy for users to customize the display and focus on stocks that align with their investment strategies.
Refer to the following image.
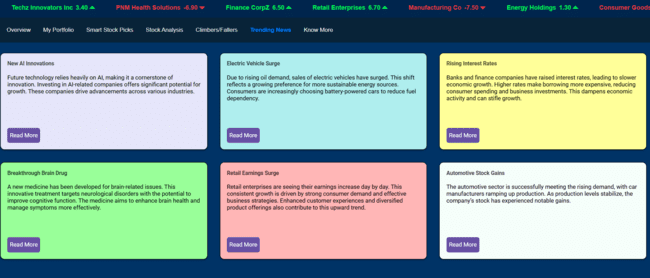
Step 6: Trending news module
The React Card component displays content in an organized and visually appealing manner, commonly used in dashboards, news feeds, product showcases, and portfolios.
The component enables users to integrate text, images, buttons, and links, making it highly adaptable to various apps. Its responsive design ensures optimal display across different devices, enhancing the user experience.
The Trending News module uses the React Card component to display key news highlights effectively. This component organizes information in a simple and visually appealing format, making it perfect for showing trending stock market updates.
Refer to the following image.
Step 7: Know more module
In this module, we have integrated the React Carousel component for a dynamic slideshow, showcasing images and context to enhance user engagement.
For this demo, the carousel showcases sample stock images as slides, serving as placeholders to demonstrate the component’s functionality. Each slide can include both an image and its related content, making it a versatile tool for presenting interactive and visually rich content.
The React Carousel component ensures a smooth and responsive slideshow experience, making it an excellent choice for displaying featured items, promotions, or other rotating content in a sleek and modern format.
Run the sample
To run the sample, execute the following command in your command prompt:
npm start
Common errors while executing the React app
|
Errors |
Solutions |
|
Module not found: Can’t resolve ‘module’ |
This indicates that the required module is either not installed properly or is missing. Therefore, we recommend ensuring that all dependency modules are installed correctly by executing either the npm install or yarn install command after deleting the package.lock.json file. |
|
npm ERR! ENOENT: no such file or directory
|
This error suggests that the specified directory or file is not available on your machine or permission for execution was denied. To resolve this, ensure that the file exists and that proper permissions are enabled to access the file or directory. |
|
npm ERR! Failed at the [email protected] start script
|
This error occurred due to a problem with the start script defined in your package.json file. To run your app, it’s important to validate and execute the start script correctly. Additionally, ensure that all dependencies are installed properly. |
|
npm ERR! EADDRINUSE: address already in use
|
This error indicates that the port number has already been used. You can choose another port or stop the existing running app. |
|
npm ERR! Invalid package.json
|
This error indicates a syntax issue in your package.json file. To solve this issue, ensure all the syntax is correct. |
References
For more details, refer to the creating a trading analysis app using React Data Grid demo on GitHub and the web.

Conclusion
Thanks for reading! In this blog, we’ve explored how to use the React Data Grid and other components to create a versatile trading analysis app. Follow the steps outlined in this blog and share your thoughts in the comments below.
Existing customers can download the latest version of Essential Studio® from the License and Downloads page. If you are new, try our 30-day free trial to explore our incredible features.
Feel free to contact us through our support forums, support portal, or feedback portal. We are always happy to assist you!


 No spam, just valuable updates.